Software companies know the data their customers produce is valuable, but aren't always su...
Software companies know the data their customers produce is valuable, but aren't always su...
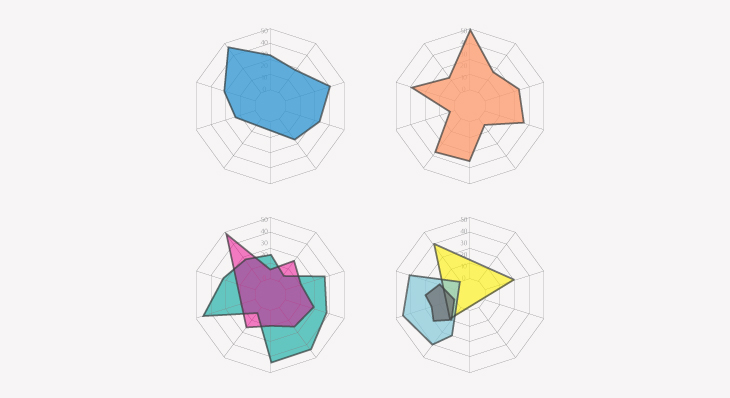
Interested in comparing multiple quantitative variables? Then let's take a comprehensive l...

BI success depends on its adoption by end-users. This is why it's crucial you provide them...

Your users are always on-the-go, so give them the ability to stay connected to their data ...

Silver-Service is achieved when the data that business users need in order to run their bu...

The Export Delivery API allows users to export and deliver Dundas BI exports through notif...
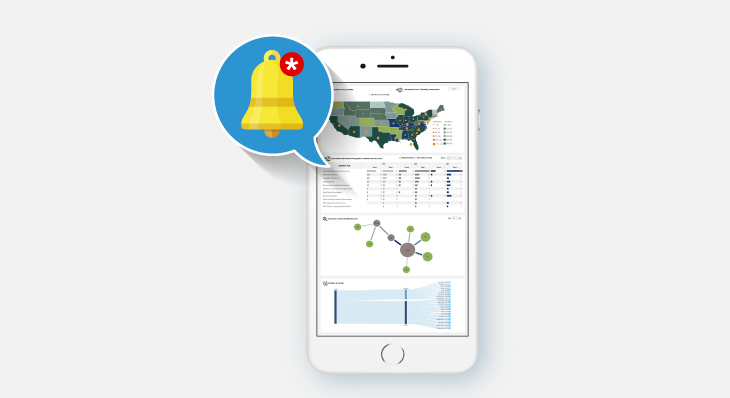
Redefine what data-driven means. With data-driven notification in Dundas BI, you'll never ...
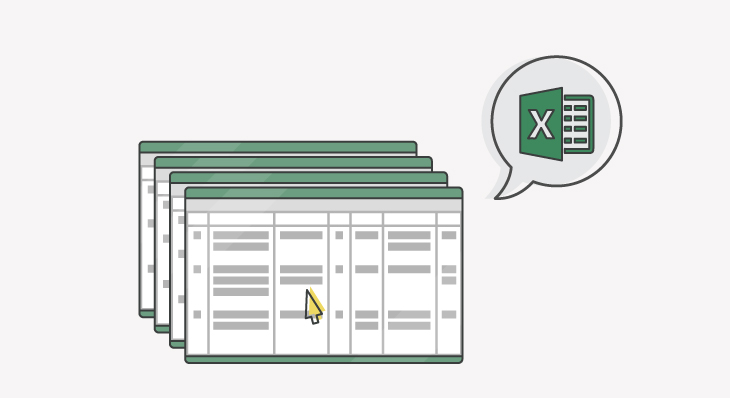
Business users who frequently work with Excel data will love Dundas BI's ability to automa...

We're focusing on one of the new ways Dundas BI simplifies data models and enables users t...

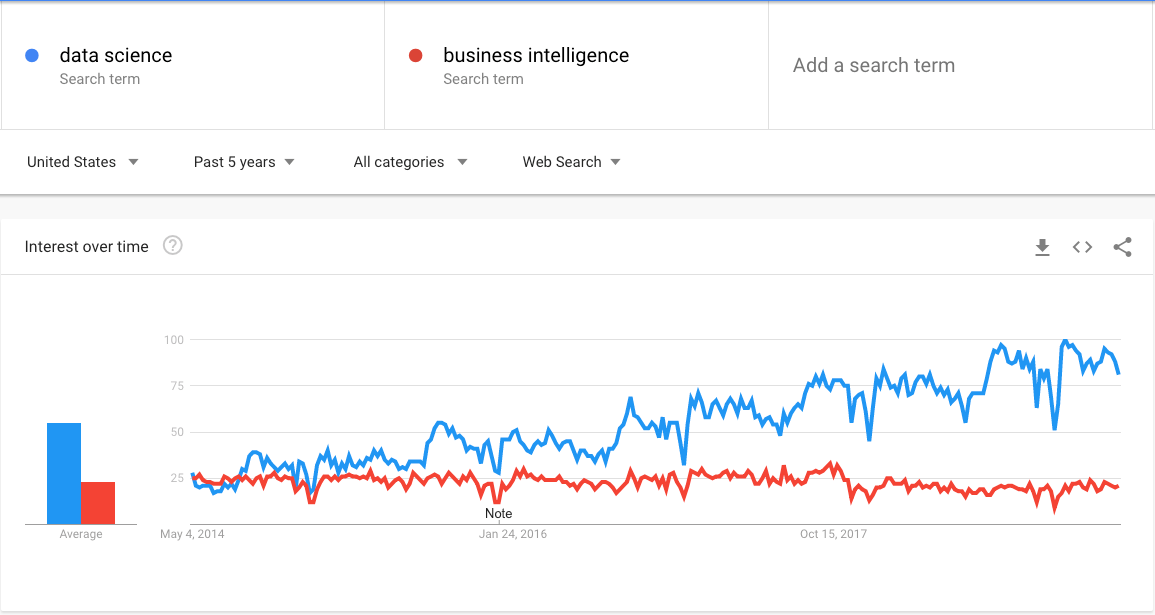
Business intelligence helps to create a better and more thorough understanding of what is ...

One great aspect of Dundas BI’s user interface flexibility is its full exposure to the und...
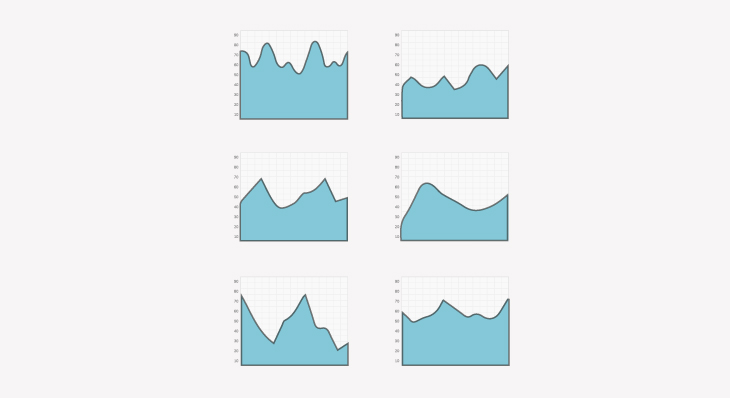
Small Multiples are a series of graphs or charts that may interchangeably be referred to a...
Follow Us
Support