
Let’s take a closer look at three forward-thinking enterprises who’ve leveraged analytics to create unique data solutions that lift their businesses and bottom lines.

Let’s take a closer look at three forward-thinking enterprises who’ve leveraged analytics to create unique data solutions that lift their businesses and bottom lines.
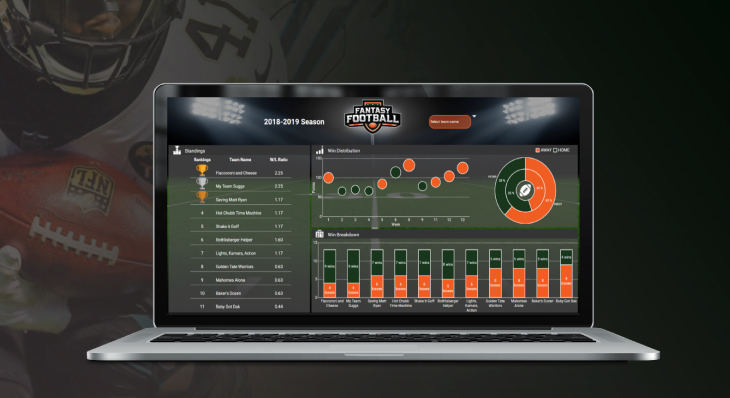
Rejoice! It's football season. Learn how to create a fantasy football dashboard with data from YOUR OWN fantasy league!
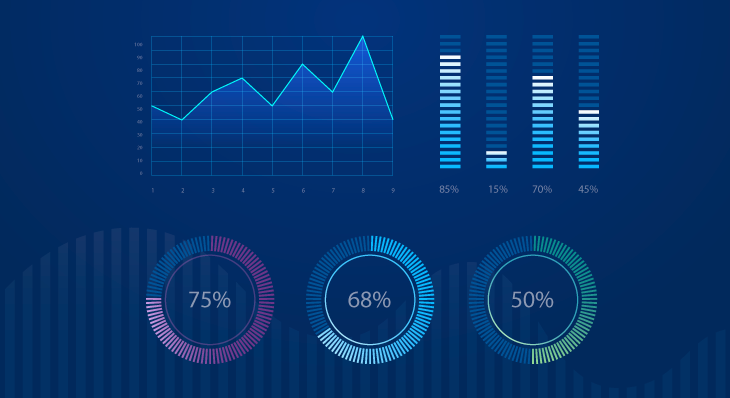
Use animations to make interactive data exploration and analysis as intuitive and effective as possible, and allow your eyes to keep track of everything when the data in your chart needs to change.

From increased user value to increased revenue, these are the top four competitive advantages of embedded analytics.

How Profunda Analytics, the experts in voice-controlled analytics, partnered with Dundas to empower users to freely navigate their data without constraints

Understanding how your business operates is vital to achieving sustainable success. Nothing will help you understand your business better than properly tracking and analyzing your business' data.

Venturing into a new Business Intelligence (BI) project can be as exciting as it is daunting. Here is a 4-step guide to implementing a successful Business Intelligence solution.

5 data visualization best practices you need to follow if you want to create meaningful data visualizations that drive home your point and unearth hidden data insights.

To ensure your Business Intelligence project is a success, I’ve outlined 8 common mistakes businesses make (and how you can avoid them).

Data visualization has come a long way. From simple cave drawings depicting the success of a hunt to the intricate dashboards we have today connecting to millions of rows of data.
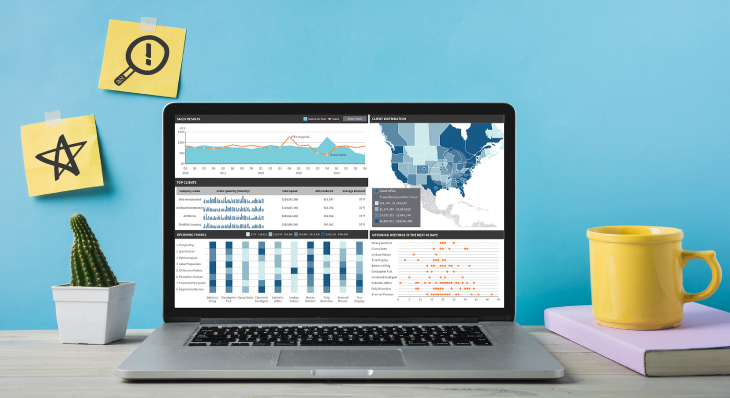
Data visualizations help companies reduce their reporting times and bring faster value to internal and external stakeholders
There is nothing of absolute certainty in this world, except for death, taxes, and accidentally deleting something you really shouldn’t have deleted. Lucky for you, there's the Recycle Bin.