Self-Service dashboards give users the freedom to explore enterprise datasets to make acti...
Self-Service dashboards give users the freedom to explore enterprise datasets to make acti...
At the time when Dundas BI was being developed, our founders wanted to ensure the platform...

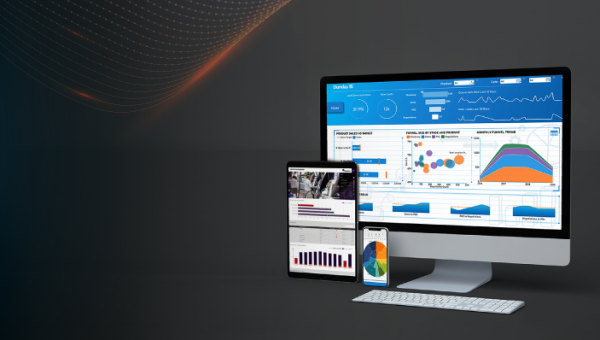
Say hello to Dundas BI Version 8, the most powerful, highest performing version of Dundas ...
With Dundas BI, we’re able to build our own 13 period time dimension with just a few simpl...
By leveraging state indicators, dashboard designers can contextualize analysis, change use...
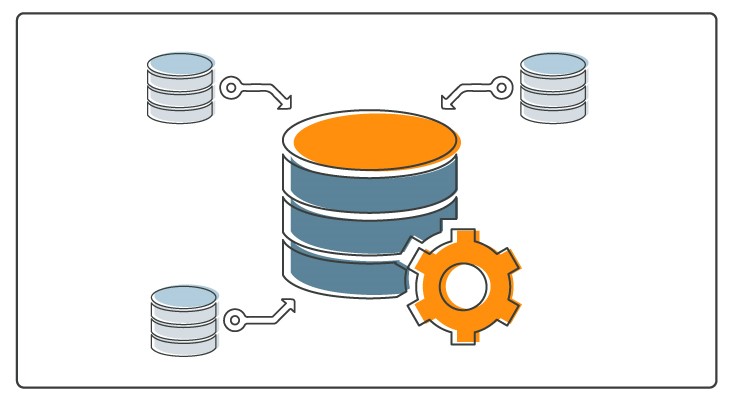
I’m going to give you a crash course in data aggregation and will use Dundas BI – our full...

Dundas BI has been ranked as a 2020 FrontRunner for Data Visualization Software, which use...
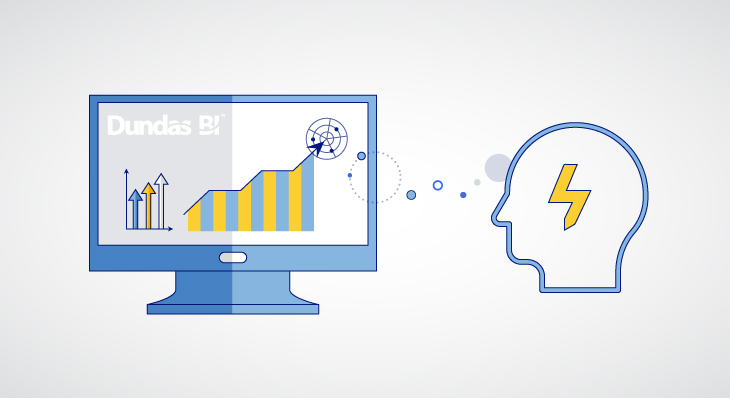
Using Dundas BI's Natural Language Assistant, tap into your data by simply conversing with...
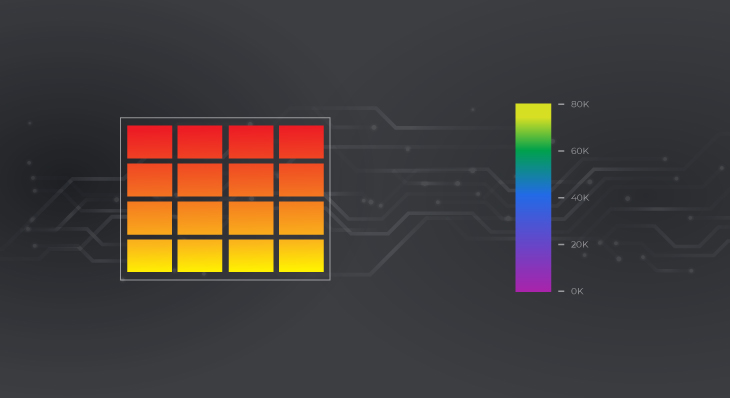
Let’s look at some exciting new visualization-based features in Dundas BI 7 - such as heat...
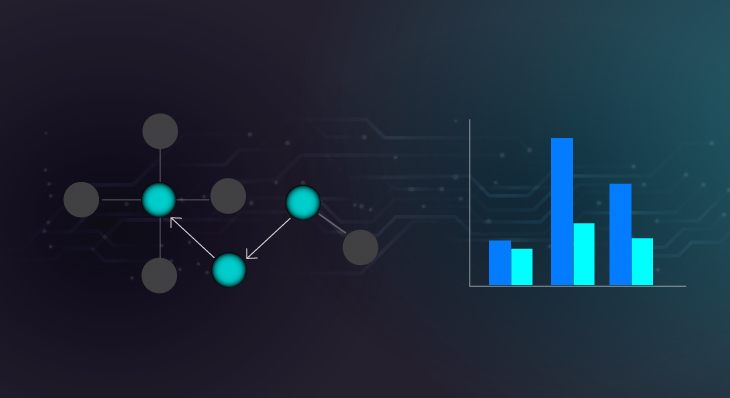
We highlight 3 brand new features in Dundas BI version 7 - such as table relationships and...

Take a look at three very exciting and innovative capabilities in Dundas BI 7; from new wa...

'Tis the season to be jolly! I'll be unwrapping four unique ways in which you can add some...
Follow Us
Support