Dundas BI connects directly to a variety of data sources – RDBMS, OLAP, Flat files, Big Data, Web services, etc. – allowing you to bring in data from quite literally anywhere and start exploring it at the drop of a hat! And as the product continues to grow and evolve, we’re continually looking for ways in which we’re able to connect to even more sources, handle complex data modeling with ease, and store data more efficiently so everybody can freely explore data.
When planning each new iteration of Dundas BI, we have innumerable objectives, however, none may be as consequential or crucial as ensuring you’re empowered to spend less time preparing data, and more time analyzing it. With our latest upgrade, we think we’ve done just that.
In this installment of Innovation Never Rests, we’re taking a closer look at Dundas BI’s enhanced ability to automatically detect tables within non-standard Excel files. With this improved feature, you’re now given the ability to simply drag-and-drop your messy Excel files onto Dundas BI’s interface, where it’ll immediately auto-detect sub-tables within the different sheets. This is a feature that business users who frequently work with Excel data – and who wish to analyze that data – will absolutely love!
BUT, before diving into what this looks like and how you can use it to your advantage, if you’re interested in learning more about the newest features and enhancements available in Dundas BI, the cutting-edge capabilities that’ll make your head spin (in a good way, of course), be sure to check out our new features page along with episodes 1 through 3!
New Features: Overview
Episode 1: Ragged Hierarchies
Episode 2: Small Multiples
Episode 3: Hierarchy Attributes
Are Your Excel Files “Messy”?
Okay, now that the administrative work is out of the way, let’s get down to business. Let’s dive into what you’re here to see! New to Dundas BI, is the ability to easily analyze messy Excel files. These are those files where the tables within your sheets don’t necessarily begin at the first row, or the ones with multiple tables on the same sheets. For example, let’s take a look at the following image:
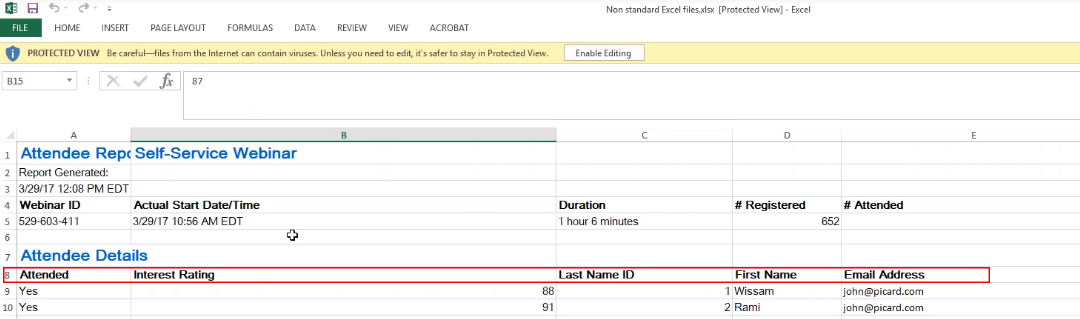
Figure 1: Non-Standard Excel File
What we’ve got here is data pertaining to a webinar we hosted last year. As is the case with most Excel files, the first few rows aren’t particularly useful, and contain data of little value. You’ll notice the first 5 rows contain information regarding the logistics of the webinar (title, date, start time, ID, duration, number of registrants, etc.), and the real meaningful data – the stuff you and your users care about – doesn’t start until row 8. What you’ll likely notice (if you haven’t already), is that this is something that’s especially common with Excel files that’ve been exported from third-party sources (which just so happens to be the case with the example we’ve chosen).
Prior to the release of this enhancement, which automatically detects tables within non-standard Excel files, if you were to drag-and-drop this exact Excel file into Dundas BI – with no changes made to it - you’d then be required to perform some type of data modeling to be able to define a data cube that then identifies the beginning of your table, along with the proper column names. That process, while not necessarily difficult, was still tiresome and took time away from the actual data exploration process.
Automatic Table Detection in Dundas BI
Now, if you were to drag-and-drop the same exact Excel file into Dundas BI today, the software will actually analyze your spreadsheet and automatically locate the best tables within, making it incredibly easy for us to jump right in and analyze the data.
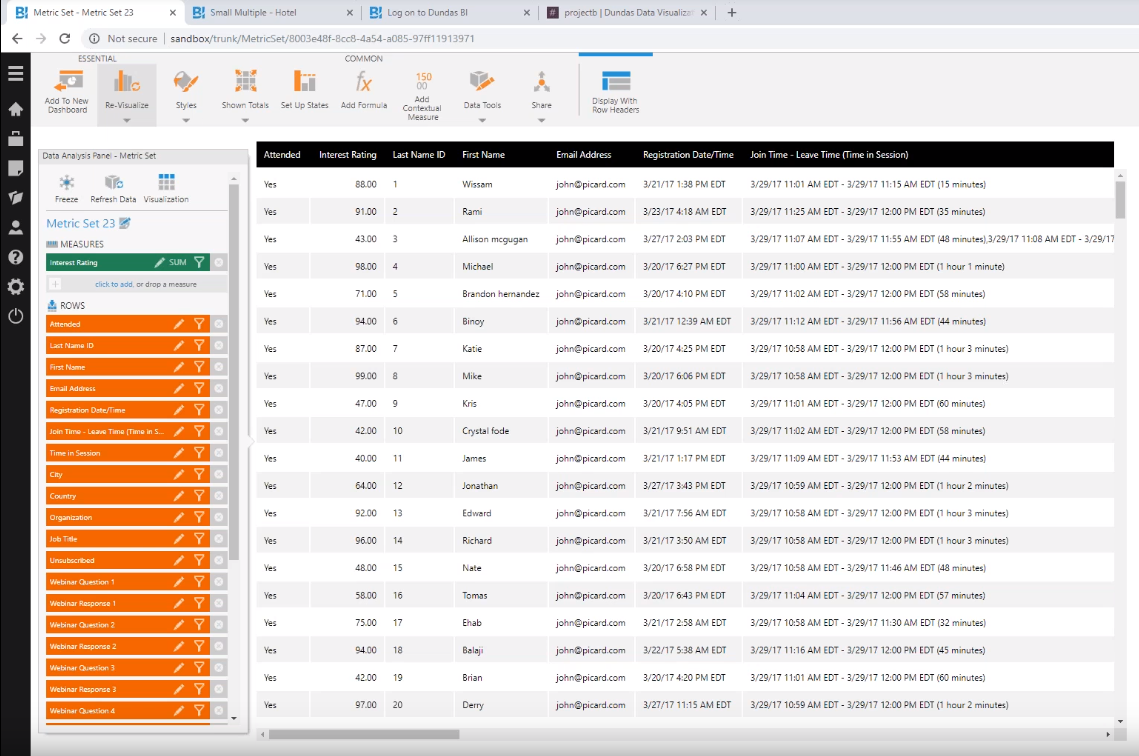
Figure 2: Dundas BI Has Automatically Detected The Table Within Excel
The above image is a snapshot of what is immediately shown to us after dragging the same Excel file as in Figure 1 into Dundas BI. As you can see, Dundas BI has sifted through our messy Excel file and automatically found the best table and has shown it to us. There was no need on our end to perform any type of data prep.
Now, if we direct our attention to Dundas BI’s explore panel, and specifically take a closer look at our data connectors, you’ll see we still have the option to view the original Excel sheet that contained our table with non-meaningful column names. Each “F#” in the image below is referring to a column within the messy Excel file.

Figure 3: Dundas BI Still Provides Access To Non-Meaningful Column Names Within Excel
However, we’ll also see the programmatic structure (pictured below), and that right there, is where Dundas BI was able to find the correct table that exists within our data set. This is a huge time saver, especially if we wanted to explore data on top of Excel, but our Excel file simply isn’t formatted to just show a table and contains additional information.

Figure 4: Programmatic Structure within Dundas BI
A Neat & Tidy Conclusion
While not necessarily a new feature per se, Dundas BI’s ability to automatically detect tables within non-standard (messy) Excel files is something that all types of users can immediately benefit from. With this enhancement, you’re able to spend less time preparing your data, and more time exploring it.
Follow Us
Support