All sales activity is measurable, meaning sales teams can leverage business intelligence a...
Business intelligence can simplify the jobs of remote workers by fostering collaboration, ...
Analyzing and making sense of large volumes of raw data is dizzying. By using Heat Map Cha...
Companies are swimming in ever-growing oceans of data and are looking for ways to make bet...
Drill-Up, Drill-Down, Drill-Through, Drill-In, Drill-to-Detail, Drill-Across... Why are th...
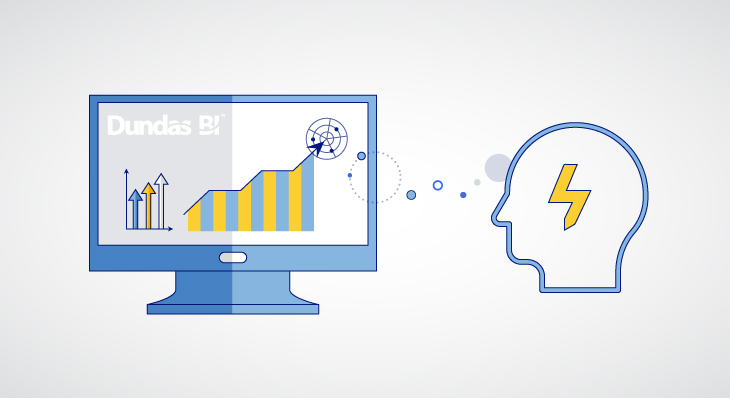
Using Dundas BI's Natural Language Assistant, tap into your data by simply conversing with...
Dundas BI is able to interact with social networking platforms like Facebook. Let's use Py...
I’ve rounded up the best of the best BI and analytics content from 2019 into one, succinct...
Let’s look at some exciting new visualization-based features in Dundas BI 7 - such as heat...
We highlight 3 brand new features in Dundas BI version 7 - such as table relationships and...
Take a look at three very exciting and innovative capabilities in Dundas BI 7; from new wa...
'Tis the season to be jolly! I'll be unwrapping four unique ways in which you can add some...









Follow Us
Support