
With 2020 squarely in the rearview mirror, let's rewind and examine the best business intelligence and data analytics content of the last 12 months
With 2020 squarely in the rearview mirror, let's rewind and examine the best business intelligence and data analytics content of the last 12 months
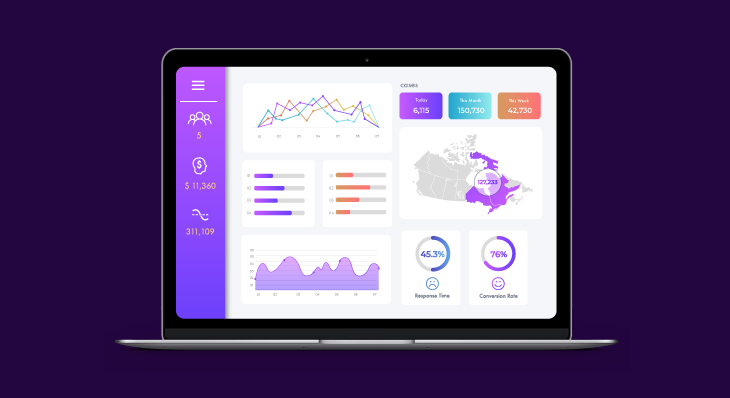
Understanding what dashboards are, what good dashboards are comprised of, and how good dashboards are designed, will help you create thoughtful, impact dashboards like these three.
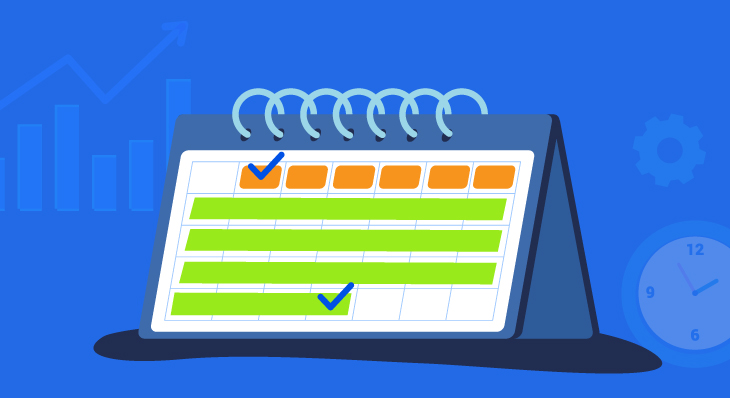
With Dundas BI, we’re able to build our own 13 period time dimension with just a few simple clicks and can perform more effective time-based analyses.
By leveraging state indicators, dashboard designers can contextualize analysis, change user’s behaviors, communicate critical information quickly, and enhance the user experience.
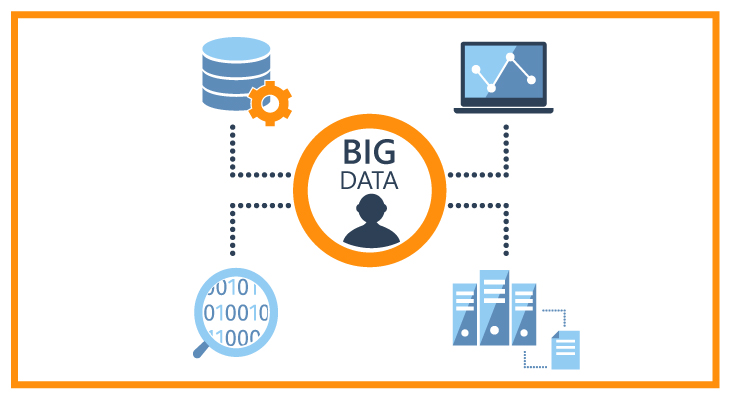
Augmented analytics will allow users to see connections they didn’t think to look for. Unlike humans, algorithms don’t have biases or preconceived notions. They connect all the dots. And that will open the door to unexpected insights—helping businesses gain a unique competitive advantage.

Here are 8 tips for how potential BI buyers can make the most out of their business intelligence software demonstrations.

Say hello to Dundas BI Version 8, the most powerful, highest performing version of Dundas BI to date.
Not every business intelligence software is capable of delivering exactly what you need, and if you’re serious about doing what’s best for your data, then you’ll seriously want to ensure these 5 analytics features are present.
In order to solve real business problems, you need a business intelligence software that provides exceptional data exploration capabilities.

Business intelligence keeps everyone, and everything, connected in your business. Enterprises are swimming in oceans of data and BI helps them analyze their data, deliver exceptional reporting and analytics experiences, and make critical business decisions

One crucial component of BI software you need to evaluate to make your decision more effective is flexibility

Finding a perfectly clean database is like finding a unicorn, and sometimes I question if they exist.