
Use map and diagram animations to faster detect changes across geo-locations. With these powerful animations, users are immediately able to cognitively identify changes in their geographical data.
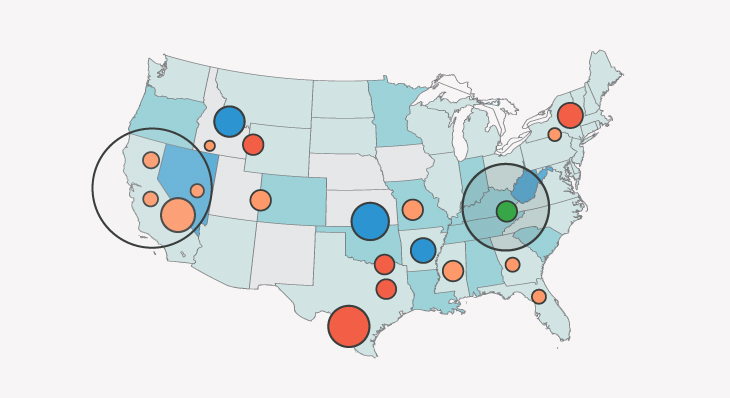
Use map and diagram animations to faster detect changes across geo-locations. With these powerful animations, users are immediately able to cognitively identify changes in their geographical data.

What can you use dashboard views for in Dundas BI? Hang on - the answer is surprisingly controversial, but also demonstrates Dundas BI’s capabilities and flexibility.
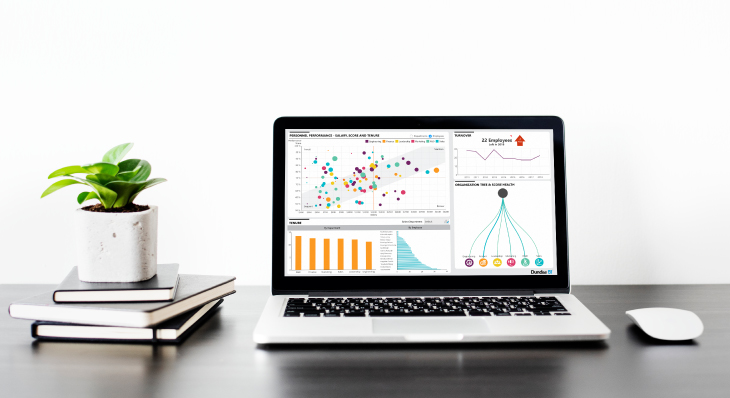
Performance optimization of dashboards is a hotly discussed topic. Let's talk about the common mistakes developers make in regard to dashboard performance and how to mitigate them.

Looking for a business intelligence (BI) tool? If so, one of the first things you’ll want to understand is how BI licensing models work.

When creating fully-fledged dashboards – you know, the ones we pour our heart and soul into – what we should strive for, is to make them as engaging and interactive as possible.
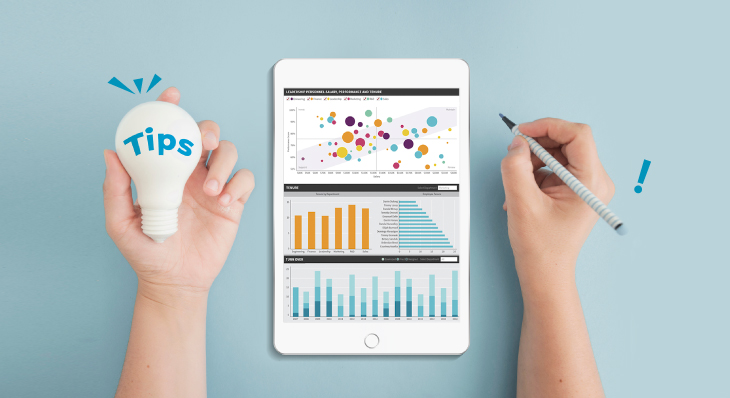
Tips and tricks to make your dashboard development in Dundas BI as efficient as possible.

Avoid onboarding delays by working with a software vendor who considers you a true business partner and is committed to your success.

When it comes to business intelligence (BI) tools and the way they work with data, there are three main data flow techniques that are typically offered.
There are ways to make data and business intelligence more palatable and ultimately increase adoption across the company. Here are four of those ways.

Do you have your own web-based application and are looking to add business intelligence (BI) capabilities to it? If so, there are a lot of technical points you need to keep in mind.

Thousands of new business intelligence initiatives are started every single day. To ensure success, we need to stop treating them as IT projects and start treating them as strategic endeavors.

The possibilities when working with weather data are near endless. Let's explore how we can incorporate and visualize weather data in dashboards in Dundas BI