
Curating data is more than simply storing it in a shared database.

Curating data is more than simply storing it in a shared database.
![The Benefits of Business Intelligence [Infographic]](/resources/images/2021/08/12/730x398_cover_thumbnail.png)
Business Intelligence has always been important but now it's essential.

When you evaluate a BI tool, you need to ensure the tool you choose will evolve with your requirements.
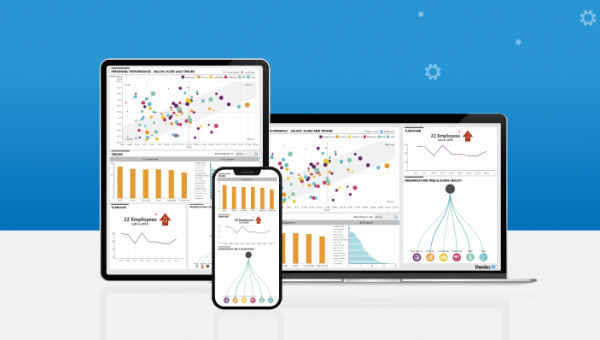
Whether we realize it or not, we've been taking advantage of embedded analytics throughout the pandemic and the trend will only rise.
Dashboards are meant to give insights. Don't just treat them like 'pretty reports'.
To join or not to join (a community) is never the question. Then what is?
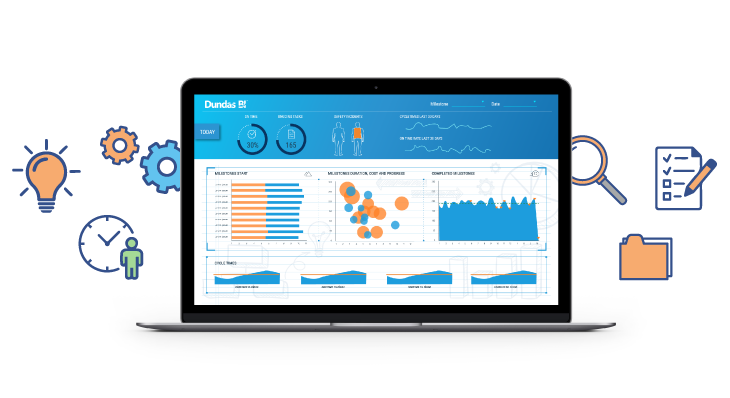
To make your BI project a real success, comprehensive requirements gathering is the first and the most important step of the journey.
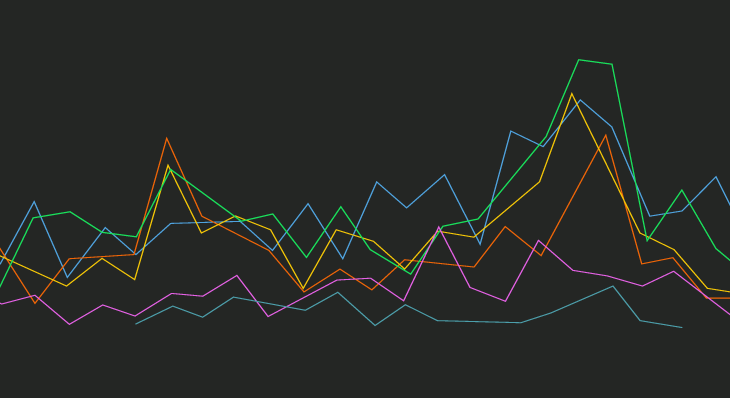
Finding an alternative to simply jamming too many series onto a single chart.

Cycle plots are an elegant visualization very few people have heard of but especially useful to understand data trends across individual segments.
Self-Service dashboards give users the freedom to explore enterprise datasets to make actionable decisions with minimal to no IT support.
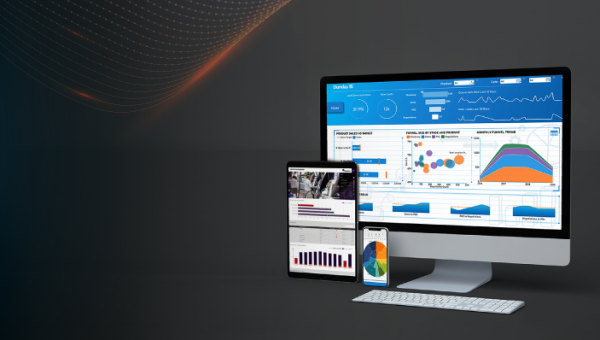
At the time when Dundas BI was being developed, our founders wanted to ensure the platform was built with a forward-looking mindset – effortlessly adaptable for the future needs of the users.
When we think about a return on an investment we’ve made — whether hardware, software, or even people — we often measure that investment in dollars.