Dundas BI is the gift that keeps on giving and keeps you coming back for more. It’s the Russian doll of the business intelligence (BI) world. Once you’re certain it’s given you all it has to offer, and you’ve become an expert in its ways, there it goes again, peeling back its covers and revealing yet another beautifully intricate and detailed layer, demanding it be explored.
Dundas BI is constantly evolving and moving forward, bringing with it cutting-edge capabilities to better handle your data analytics. In this series – Innovation Never Rests – we take a deeper look into the newest features and functionalities available in Dundas BI and explore the impact each has and how you can take advantage of them. In this installment, we’ll be covering the Export Delivery API, which allows users to export and deliver Dundas BI exports through notifications, and the role it plays in creating a more collaborative BI experience. But before doing so, feel free to take a look at our previous entries in this series:
New Features: Overview
Episode 1: Ragged Hierarchies
Episode 2: Small Multiples
Episode 3: Hierarchy Attributes
Episode 4: Automatically Detect Tables Within Excel
Collaborative Business Intelligence
The ultimate goal for business intelligence solutions, regardless of what industry you’re in – be it healthcare or manufacturing or retail – is to reveal data insights so better actions can be taken. We’ve talked at length about how notifications can be leveraged to ensure action is taken, and have covered best practices when discussing data insights, but what we’ve yet to talk about, is how these conversations can be carried on outside of your BI environment.
Business intelligence software enables business users to unlock the data insights they need, in the ways they need them. In other words, BI empowers us to make accurate decisions quickly. Collaboration tools on the other hand, provide an avenue for BI reports and dashboards to be accessed and shared by multiple users. On their own, each of these is great, but together… well, now we’re cooking. Business intelligence software and collaboration tools go together like hot dogs and baseball games, cable cars and San Francisco, and Batman and Robin. Singularly, each is formidable, but together… that’s a winning combination.
You see, when discussing business intelligence software, adoption is arguably the single most important indicator of success, and nothing says adoption, quite like collaboration. You can design the most breath-taking dashboards and break down every single barrier to data accessibility, but if your users aren’t actually collaborating with one another and sharing their insights, you’re not likely to make the most of your BI investment. Just because you’ve built it, doesn’t mean they’ll come.
When paired with one another, BI and collaboration tools provide some unique benefits:
Better Decision-Making
- More informed, timely, accurate decision-making is the end goal of business intelligence. That we’ve already agreed on. A collaborative business intelligence environment will support this goal, by enabling teams to better assess their data and make better decisions. It’ll also ensure companies are better positioned to track and analyze feedback that will directly impact the decision-making process.
Increased Interactions
- Put simply, the more sharing there is of data insights and the more discussion surrounding them, the more likely it is that business processes are to be improved. It’s critical that data insights are easily discoverable and documented on, and a more collaborative process can assist with this.
Enhanced Discussions
- There’s no disputing that data insights on their own are incredibly valuable. However, through a more collaborative process, it’s possible to augment and better understand insights by introducing communicative feedback to them. These can come in the shape of comments from colleagues, outside content such as blogs and other related research, etc. By using collaboration tools to add additional knowledge to existing insights, it’s easier to apply context and determine why the insights are what they are.
Where Communication Flows, Data Should Go
Before diving into what this means in regard to Dundas BI and the specific role the Export Delivery API plays, let me first ask you a question. Where are you communicating most with your colleagues? Is it over your company’s Intranet, or in email-threads, or are all decisions made at the water cooler? No, no, and most definitely no! The majority of communication today occurs naturally, in business collaboration hubs such as Slack, Lync, and Flock. These tools are the closest things we have to natural, direct, in-person communication and make collaborating online that much simpler. So, does it not make sense we leverage these collaboration tools and integrate them with the data insights we’ve gleaned from our business intelligence software?
Deliver Dundas BI Analytics Directly to Slack
What we’ve done in Dundas BI, is created a new type of API; one that essentially allows you to create new ways of sharing and delivering your emails. What this means is that with Dundas BI, it’s possible to create custom export and delivery providers so shares and notifications can seamlessly integrate with your existing work flows. For example, you’re able to share visual data analytics results directly to your Slack channels!
Before getting deeper into this, it’s worth noting that while the remainder of this blog will focus on the specific integration with Slack, with this API, you can actually extend Dundas BI and easily integrate with any other type of environment that you want to share exports to. Also, if you’d prefer more technical details on how specifically to use custom export and delivery providers to allow users to export and deliver Dundas BI exports through notifications directly to Slack channels, check out this article.
OK, let’s get into it! What I’ll be showing you, is what it looks like in Dundas BI to export a dashboard directly into a Slack channel.
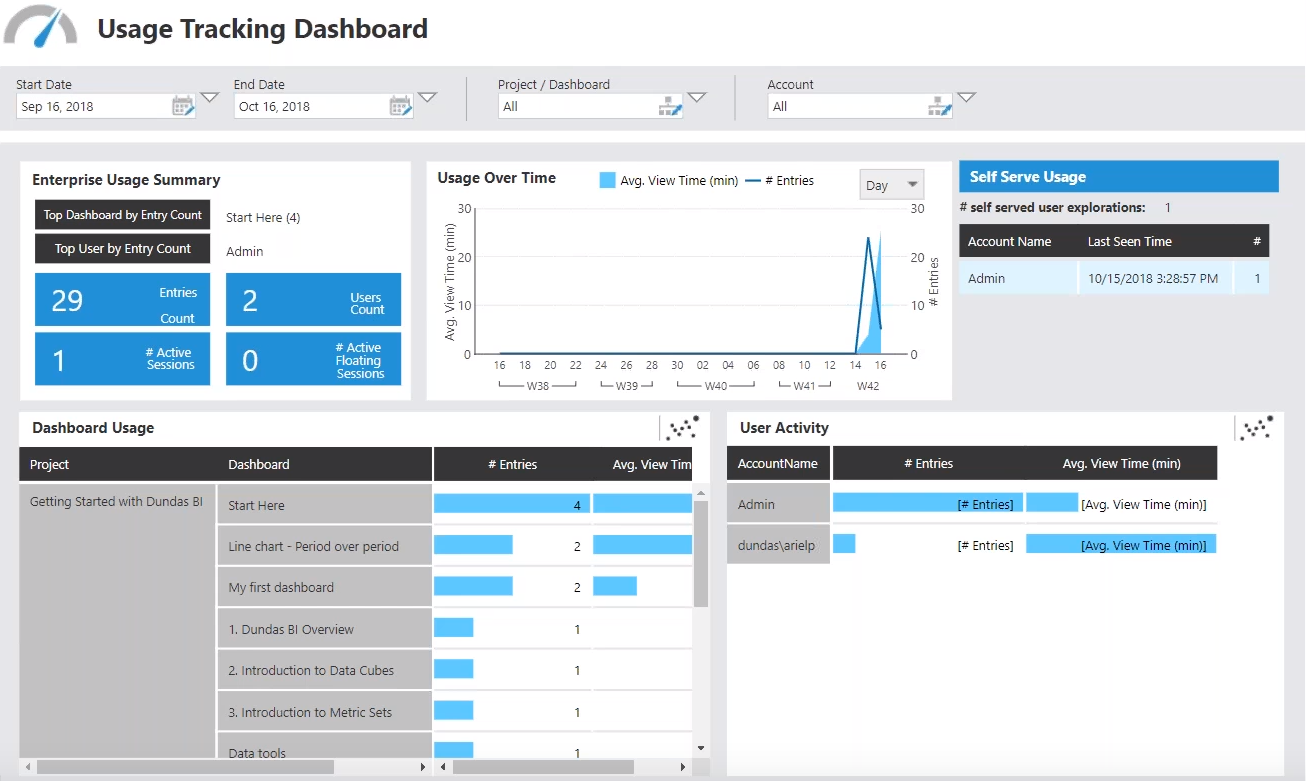
Figure 1: Usage Tracking Dashboard in Dundas BI
What we have here, is a simple Usage Tracking Dashboard that’s been built in Dundas BI. The end goal is to share this dashboard in a Slack channel of our choosing. How can we do this and what does it look like?
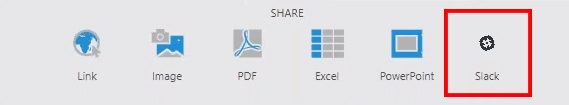
Figure 2: Using the Export Delivery API in Dundas BI to create a new Slack export
As you can see in the image above, we’ve gone ahead and used the Export Delivery API to create a new type of export, which in this case, is now going to allow us to distribute our information into Slack.
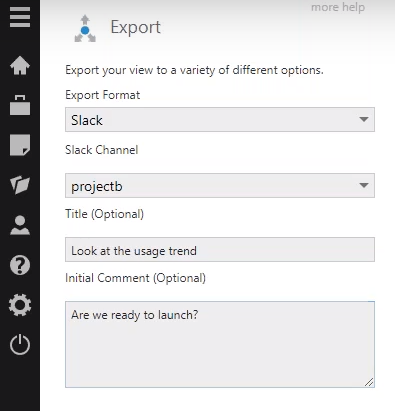
Figure 3: Selecting the Slack Sharing Option
Once we’ve selected the format by which we plan on exporting our dashboard, we’re then able to decide which Slack channel we’d like to use and can include any titles and comments relevant to the dashboard; here’s where we could choose to include anything that might kick-start a discussion. This will now be shared directly to our Slack channel, so that everyone who belongs to this channel, will be able to see this dashboard that’s come directly from Dundas BI.
Yes, it’s that easy!
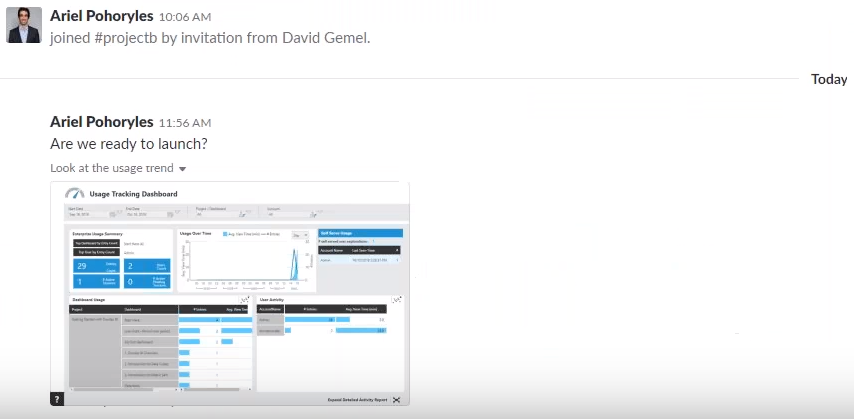
Figure 4: Dundas BI Export in Slack
If we head into our Slack channel, here’s what the export would look like. It’s all seamlessly integrated with Dundas BI; we’re able to open it, view it in full screen, and begin conversing about the data, directly within Slack.
Signed, Sealed, Delivered
Keep in mind, this Slack example is one specific use case for the Export Delivery API. It can also be used to integrate with any other data or business process, or workflow that you want. It could be FTP, it could be Twitter, or it could be anything else. The options are truly endless.
Once again, if you’d like specific technical details on how exactly to replicate this Slack example in Dundas BI, check out this article.
Follow Us
Support