At Dundas, business intelligence (BI) is our domain. We help businesses transform their outdated, old-fashioned reporting processes by replacing them with modern analytics. Empowering the masses with the data insights they’ve been missing is what we do.
However, we’re not content with simply helping businesses recreate their reporting using a modern platform. That’s just the beginning. You see, we’re also in the business of constant innovation, and are on a mission to bring you the most cutting-edge capabilities to better handle your data analytics. Innovation never rests, and neither do we; especially when it comes to your BI experience. We’re obsessive about being the best, and our rapid release cycles ensure you can ALWAYS expect new ways to prepare, visualize and interact with your data.
Welcome to Innovation Never Rests; our bi-weekly segment that highlights the newest features and enhancements available in Dundas BI. Follow along to stay up to date on what’s new in Dundas BI. This edition is all about handling complex data models with Ragged Hierarchies.
Ragged Hierarchies vs. Unbalanced Hierarchies
One of the more common challenges a lot of organizations encounter, is around being able to manage their hierarchies when they’re not perfect. And what I mean by imperfect hierarchies, is that they don’t always span across the same number of levels, and don’t always move from one level to the next in proper succession. In these instances, the hierarchies can be referred to as either being ragged or unbalanced. While these types of hierarchies are by no means unusual, the process of modeling them into a data structure that users can explore and interact with is quite complex. With Dundas BI, however, we’ve made it possible to handle complex data modeling with ease, and have taken the leg-work out of creating hierarchical data models that support your analysis.
While we’ve dubbed our newest feature Ragged Hierarchies, we’ll let you in on a little secret; we actually support both ragged AND unbalanced hierarchies. Queue the celebration! But what exactly are the differences between these, and how do they deviate from normal, balanced hierarchies?
Balanced Hierarchy
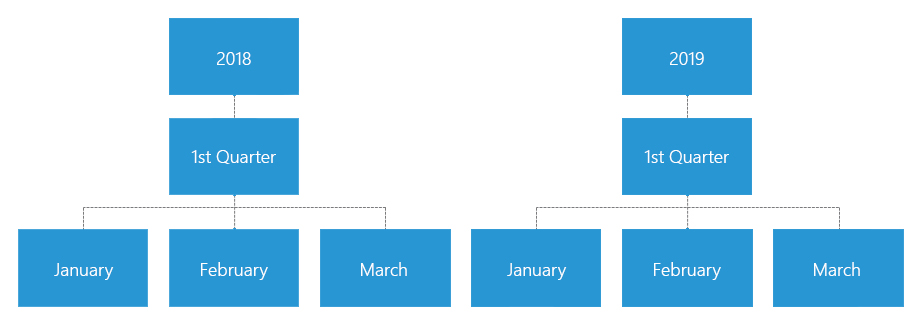
Hierarchies consist of a number of members (nodes), each belonging to a parent. Generally speaking, in a balanced hierarchy, each branch of the hierarchy descends to the exact same level, with the logical parent of each member residing immediately atop the member. With this structure, a balanced hierarchy will often resemble a tree; with members branching away from their parents, which have branched away from a root node.
One of the most well-known examples of a balanced hierarchy is the time hierarchy, where the depth of each level (year, quarter, and month) is consistent. With this common use case, all branches extend to the bottom level, and each leaf (also known as a child of the node/member) is linked to that level.
Unbalanced Hierarchy
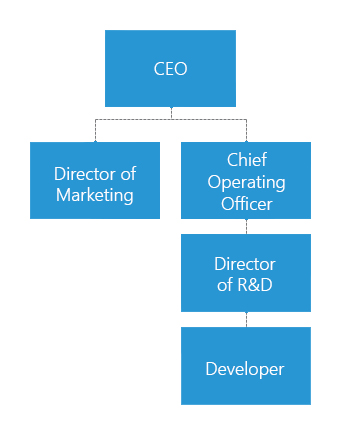
Alternatively, an unbalanced hierarchy is one whose levels are logically inconsistent while still maintaining a consistent parent-child relationship. What this means, is that some branches of the hierarchy will have more levels than others, and all leafs will not be connected to the same level (i.e., are found on different levels).
A good example of this is a simple organization chart. While logical in the sense that each member of a dimension is immediately above its child member, some branches in the hierarchy have more (or less) levels than others. In this example, the CEO is solitary in her position at the apex of the tree. Occupying the second level are those who report direct to her, the Director of Marketing and the Chief Operation Officer (COO). Under each of these is a tertiary level comprised of child-nodes who sit immediately below them. However, as the branches under the COO extend further than those under the Director of Marketing, the hierarchy becomes unbalanced.
Now, before diving into ragged hierarchies, it’d be remiss of us if we weren’t to discuss the question of number of levels associated with both balanced and unbalanced hierarchies. A balanced hierarchy (i.e., a time hierarchy) usually has a fixed number of levels that have been well-defined when creating your data model. An unbalanced hierarchy (i.e., an organization chart), however, will typically possess an unknown (n-level) – or even dynamic – number of levels. These aren’t hard and fast rules though, as it is possible for unbalanced hierarchies to have fixed levels and balanced hierarchies with unique linkages that would ultimately make it unbalanced.
All this is to say, that unless your hierarchies have a fixed number of levels and are balanced, it can be quite difficult to create functional data models for deeper analysis.
Ragged Hierarchy
Unlike fixed level, balanced hierarchies – whose branches all descend to the same level, and whose nodes’ logical parents are at the level immediately above them – ragged hierarchies need not abide by the same rules. With ragged hierarchies, some branches may be missing certain levels. What this means, is that at least one parent node will not be at the level immediately above its child-node.
Take for instance the following example. We’ve two branches. The North American branch descends consistently through each level (Continent, Country, State/Province, and City), however, with the European branch, you’ll notice we skip the Provincial level entirely and move directly to the City level.
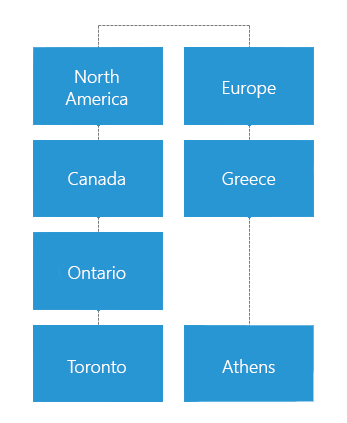
It’s worth mentioning that like unbalanced hierarchies, the branches of a ragged hierarchy can too descend to varying levels.
How Dundas BI Tackles This
Dundas BI addresses the obstacles that arise when dealing with ragged and unbalanced hierarchies by allowing you to define hierarchies for data with uneven numbers of levels. What this means, is that with Dundas BI, you have the ability to take these hierarchies and create data models, so that your users can easily see and interact with data that’s organized differently at various levels. In other words, users with no understanding of your underlying data sources will be able to easily drag and drop data from your hierarchy, see the correct aggregated values at each level, and drill down and up across the hierarchy to further see the breakdown under each branch.
Pretty stellar feature, right? We’ve put together a quick video to demonstrate how Dundas BI handles ragged hierarchies and what this looks like from your point-of-view. In this video, we’ll also briefly cover what’s been mentioned already in this blog, so feel free to skip ahead to 3:40.
Let's Summarize
Dundas BI allows you to identify your hierarchies as either ragged or unbalanced, and define it as so. By enabling you to define your data directly within the software as either of these types of hierarchies, you gain the ability to navigate and aggregate your data across the same levels. This means you’re able to drill into (and out of) your data with ease, and avoid the need for complex data modeling processes.
Already using Dundas BI? Here are the detailed setup steps
New to Dundas BI? Schedule a demo or get your hands on it with a free trial/download
Follow Us
Support