
This was a challenging year. Like many, our most heavily used buzzwords were adapt and pivot, and we often found ourselves doing both as we navigated the choppy waters that were 2020. And, like many, we were forced to re-evaluate our best-laid plans and come up with innovative strategies for how we would continue providing our customers with the high-quality products and services they’d come to expect.
Luckily for us, we’ve never had a problem adapting, or being flexible for that matter – in fact, the flexibility of our software is mutually tied to the flexibility of our teams. So, while we’ve had to make some conscious, radical shifts in an effort to not only stay on track, but one step ahead, one thing hasn’t changed, and that’s been our approach to helping you better handle your data analytics through continuous innovation and cutting-edge features and functionality.
Yes, 2020 has been one for the history books. But it’s also been a year of immense growth. And rather than sit back on our haunches and operate under a fixed mindset, our teams pushed themselves harder than ever and proudly released Dundas BI Version 8, the most powerful, highest performing version of Dundas BI to date!
We’ve acknowledged that problems and work today are more complex, and our customers are ever demanding more from their analytics. That’s why Dundas BI Version 8 comes stocked, out-of-the-box, with loads of new features to help organizations break down the barriers preventing them from reacting, adjusting and tackling business priorities. I won’t get into every little feature and fix – there’s well over 100, which you can read more about here – but I will highlight some of the most exciting and significant below!
Installation & Deployment
When Dundas BI was first released, users were only be able to install it on Windows. This worked for the majority of people because after the software was installed, they’d be able to log on to the application from any device, as long as it ran a supported web browser.
However, as our software matured, and as more and more users wanted the freedom to deploy and manage Dundas BI according to their organization’s IT standards, we knew we needed to offer more ways to install. This led to us combining Dundas BI with the powerful enterprise capabilities of Linux!
Now, while this is a pretty big deal, it was only the beginning! With Dundas BI Version 8, we’ve now made it possible for users to deploy using Docker containers and to Kubernetes using Helm Charts! What deploying Dundas BI using Docker containers does, is allow users to access scaling and high availability features for cloud deployments or their own server clusters. In regard to Kubernetes, users are able to manage their containerized deployments and even automate new nodes as they scale.
In other words, we’re now giving users the power to run Dundas BI on the operating system or cloud platform of their choice and use scaling and high availability options such as Kubernetes!
Design & View
Charts in Dundas BI typically fit all of their data points into the set size of the chart. This is so that at-a-glance, users are able to visualize the dataset in its entirety. But what if you wanted to zoom in to view the data in greater detail? What if your chart was comprised of too many data points and you wanted to restrict the number displayed at a particular time? What if your vision was strained and you needed a closer look at a specific cluster of data points?
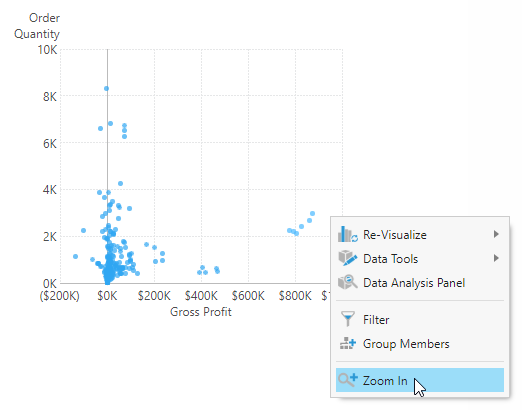
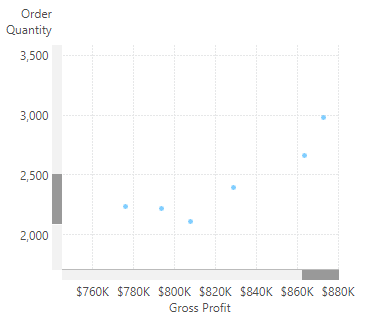
Well, you’re in luck, because with Dundas BI Version 8, charts now have the ability for users to ‘zoom in’ to them! Simply click and drag your cursor across a region of data to select it, then right-click and zoom in! Scroll bars will even appear along the chart axes, allowing you to view the rest of the data in the chart at that particular level of detail.
There are other ways for a user to zoom in and out as well, such as automatically, when displaying a certain number of values at a time along an axes, or manually, by clicking the zoom options in the toolbar or context menu in the application.
Administration
What are the security options available in Dundas BI is a question we are frequently being asked. In fact, this question arises so often, we decided to make a video that dives into some of the many ways Dundas BI can be customized to allow for genuinely enterprise-level security. In it, we cover security in regard to different types of users, login and authentication, data security, feature security, filesystem security, and auditing and logs.

With Dundas BI Version 8, we’ve added yet another security feature to our already exhaustive list – we just don’t know when to stop! When dealing with sensitive data, security is of the utmost importance. That’s why our latest release makes it possible to create highly secure environments, by restricting users and groups to only login from specific IP addresses or a range of addresses. What this does, is provide businesses with an additional level of protection in the unfortunate circumstance an account is compromised. Even if the attacker were to acquire login credentials, they’d still need physical access to the compromised users’ location to gain access to their account and obtain their data.
I’d like to see you try and find a business intelligence software more secure than Dundas BI!
Data Preparation & Analysis
We’re always looking for new and smarter ways to prep, visualize and interact with complex data, and with Dundas BI Version 8 we’ve come out the gates swinging by adding/making improvements to three great features that will totally enrich your users’ experiences.
The first of these features is the ability to perform more relevant period comparisons using a 13 period calendar, which is a type of calendar that – as the name suggests – consists of 13 periods of exactly 4 weeks each. This calendar is an absolute game-changer when it comes to monthly analysis since every period is now consistent, making trends exponentially more accurate and easier to spot. Whether your fiscal year begins on January 1st, or December 15th, or you need better comparability of numbers between periods during your weekly report prep work, or you simply have nothing nice to say about Gregorian calendars, Dundas BI Version 8 makes it possible to report on data using 13 period calendars.

If you’re familiar with our slicer comparisons, then this next improvement is sure to wet your whistle. For the uninitiated, the slicer comparison is useful for measuring values against different filter values. For example, using this feature, you can easily compare a data set displaying Global-Yearly Results with Regional-Yearly Results. Some have even said that the slicer comparison is the coolest self-service tool you’ve never heard about! It’s one of those features that goes a long way in balancing the need for self-service vs. creating a usable system for users. And, while already immensely popular, we’ve made it so that slicer comparisons can now be added that compare multiple slicers and formulas. I know, we’re coming out with stuff you didn’t even know you needed, but now can’t wait to get your hands on!
Our last big improvement in this category is to our state indicators. This feature is a little more well-known than our others, so I’ll let you read this blog if you want the whole kit and caboodle. If you don’t want to read that entire article, I’ll sum up what you’re able to do with state indicators and what improvement we’ve made with Dundas BI Version 8.
States are used to check for conditions in your data that you define. There are many different use cases, such as for indicating when data is within – or out of – a certain range, calling attention to specific data points, or for comparing measures, values or period-over-period comparisons. One of the most common use cases, is for displaying positive (good) and negative (bad) conditions, or for highlighting outliers in your data.
By leveraging easy-to-implement, yet incredibly powerful states, you’re able to use visual elements on the dashboard to change your users’ behaviors, impart critical information quickly, and enhance the overall user experience. What makes this feature even better, is that with Dundas BI Version 8, you’re now able to display values from data in state indicators – in addition to the current state – in its text or its tooltip popup! This is a great accessibility feature and is exceptionally useful when the need arises to display more details.
General
Our next significant Dundas BI Version 8 feature is all about productivity, and helping you be as productive as possible when using our software. What we’ve done, is allow you to work on multiple items at once, across multiple tabs. That’s right. You’re now able to stay on the screen and item you’re working on and simultaneously correct items in a new tab by taking advantage of our newly introduced pop-up option. Now you can quickly make the changes you need to make while still working on your initial dashboard – or metric set, or literally whatever it might be you’re already working on! Check out this quick video to see what this feature looks like.
If you’ve kept track thus far, that’s 8 powerful, new features/enhancements in Dundas BI Version 8. But, since it’s the giving season – and I’m feeling especially generous - I thought I’d add one more to the list.
While the above features are all noteworthy, not all will be used by every person. Some charts simply aren’t relevant to specific use cases. Some industries are die-hard fans of the Gregorian calendar. And some people – we’ve not met any, but I’m sure they exist - just don’t like having secure data! But what I can say – with 100% confidence – is that all our customers care about speed! And it’s for this exact reason we took a look ‘under the hood’ and made some adjustments to our software all in the name of speed. In doing so, we made Dundas BI the fastest it’s ever been. In fact, every page within the application will now load faster than ever.

Conclusion
When we talk about Dundas BI having all the features you want and none of the waiting, this is exactly what we mean. Beyond providing you with a blindingly fast application, we make a point to bring you the cutting-edge capabilities you need to handle your data analytics as frequently as possible. With fast cycles and a focus on new features driven directly by our customers, we’ll always have something to get excited about – and most importantly, something that’ll help your businesses better leverage analytics for game-changing insights.
Try Dundas BI Version 8, free for 25 days, and bring your data to life.
Follow Us
Support