Business intelligence (BI) is a catch-all, umbrella term. It’s used to describe data exploration, data analytics, data visualizations, reports, software infrastructure, the mining, aggregating, and cleansing of data, and the overall practices businesses implement to become more data-driven. It spans a range of processes and activities from statistical analysis, to visual analysis, to data collection and storage, to data preparation and more, usually with the goal in mind of optimizing performance.
Business intelligence offers myriad benefits, but at its core, BI ultimately helps businesses tap into their data to solve real business problems. And if it doesn’t do that, then it’s not doing its job. Which is why, if and when you find yourself evaluating BI software vendors, you’ll without a doubt want to ensure you assess only the vendors that promise to do just that; promise to be capable of helping you achieve your wildest and most pressing business goals.
Unfortunately, promises are nothing more than a bunch of words and sentences strung together. And until you’ve gotten ahold of concrete proof, right there in front of your eyes, promises are nothing but empty claims that business intelligence vendors all too often make. It’s a tale as old as time. Vendors claiming their software is the easiest to use, or the most scalable, or has the best data visualizations... Many vendors will say whatever it takes to one-up the competition – or cut them off at the knees. There’s a lot of noise out there, and it’s up to you to sift through it all and narrow in on that one BI software that gives you everything you need to perfect your data exploration and realize your analytics dreams.
The overall analytics and business intelligence software market is rapidly growing, with global BI revenues projected to reach $29.48 billion by 2022 – there are new vendors literally cropping up daily. So, in a crowded market with enough options to make your head spin, how can you make a decision you can stand behind? How can you whittle down the many into a group of premium BI software you can properly evaluate?
Fortunately for you, we’ve put together a list of 6 must-have functionalities to look for in a business intelligence software to assist with data-exploration, expedite your evaluation process, and set yourself up for success.
1) Customizable Data Views
The ability to merely display data on dashboards is old-hat. Early iterations of the digital dashboard have been around since the 1980’s, and a lot has changed in the past 30+ years. The world moves fast, and you need a business intelligence software that’s just as quick. Be sure the tool you evaluate provides customizable, enterprise-level, self-service dashboards that allow you to explore data and monitor and measure the performances of your business metrics in real-time. Look for a tool where you can quickly and easily design fully responsive data views (dashboards, reports, small multiples, etc.) using smart drag-and-drop design tools, data visualizations, and a range of styles, themes, and templates.
Every data view you create should be highly customizable, meaning you’re able to add any combination of data visualizations and components and arrange them however you like. No pixel should be untouchable. Then, once you’ve nailed down your design, make sure these data views can be filtered and drilled-into, and that you can perform advanced analyses and calculations directly on the interface. Simply put, you should never be limited or constrained by your business intelligence software – especially when it comes to its visual elements. The impact on data exploration the ability to visually interact with personalized data views has cannot be understated.
It’s our recommendation you evaluate BI software with data views that are customizable and extensible enough for you to gain valuable insights however you see fit.
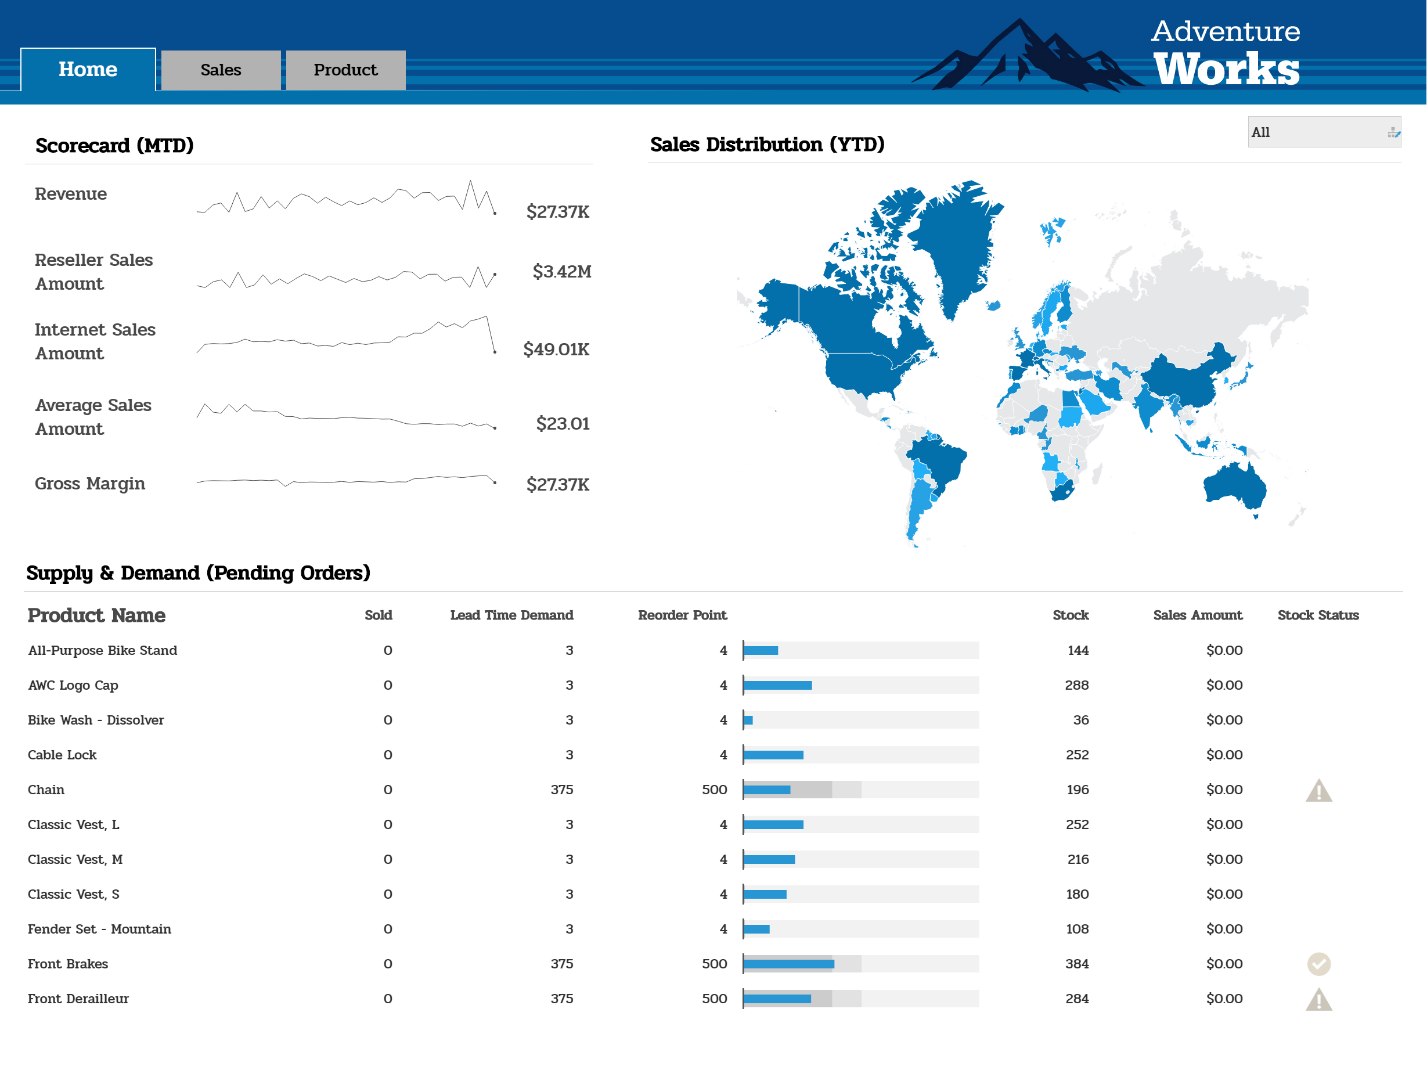
Figure 1 – Example of a Dashboard in Dundas BI
2) Smart Data Visualizations
What better way to engage your users and help them tap into the real stories their data is telling them, than with highly interactive, visually stunning, smart data visualizations? We’ve long believed data visualizations to be the modern day equivalent of visual communications, and those with superb interactivity can not only help users understand data better, but faster as well.
In the context of business intelligence, data visualizations are interactive representations and techniques that are displayed as visual objects, whose purpose is to clearly communicate the significance of data to those who view them. Data visualizations are handy, as they’re more likely to reveal and identify patterns, trends and correlations within data that would typically go undetected in less-graphic variants (such as text or table based data). It’s important to note that virtually all business intelligence software features data visualizations in some capacity. So, you need to be especially attentive and vigilant when evaluating how adept a tool’s visualizations are at aiding data exploration. The best data visualizations are those that are interactive, beautiful, and come loaded with extreme customization properties that arm users with staggering granular control over nearly every single design element.
The smarter your data visualizations, the better your visual delivery. The better your visual delivery, the more engaged your users are in the messages you’re conveying. The more engaged your users are, the higher the BI software adoption rate and the more likely they are to unearth data insights.
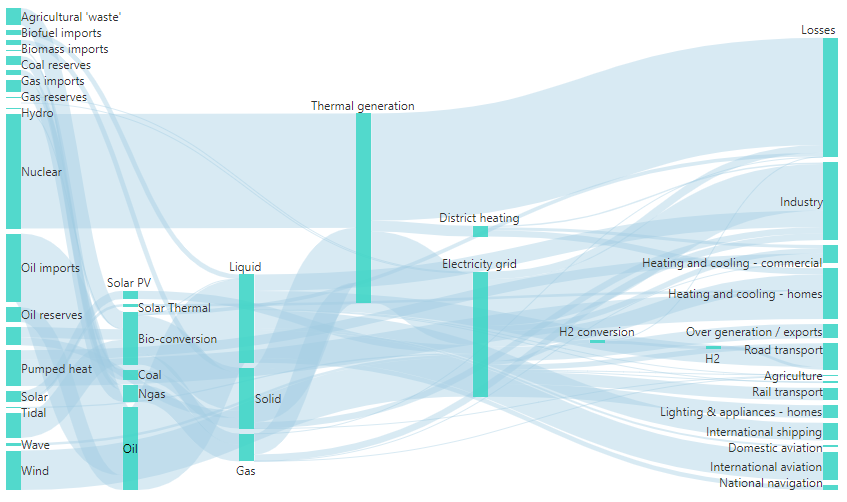
Figure 2 – Example of a Sankey Diagram in Dundas BI
The above image is a Sankey Diagram from Dundas BI. This particular smart data visualization is designed to show relationships in a flow as opposed to by connections without any specific structure. For more examples of smart data visualizations, take a look at this eBook – 10 Advanced Data Visualizations.
3) Seamless Data Integration
What good is it if you pour all your effort into building a phenomenal business intelligence solution just to have a poor user experience negate all that hard work? Nothing – and I mean nothing – is more frustrating and unappealing for a user than using poorly designed or complicated tools and having to learn new systems, processes and functionalities associated with them. There’s a reason so many familiar, and even duplicate, experiences and interfaces exist today. It’s because they work, and they work in part because users have a predisposition to them and have a benchmark level of familiarity.
What you need to evaluate in a BI software, is how capable it is at integrating into your existing systems and whether or not it can be customized to look and work like whichever applications you choose to embed it within (be it in a full-fledged stand-alone application, or as a widget on your website). A fully programmable business intelligence software – one that was designed with customization, extensibility and ease-of-integration in mind – will be able to consolidate data from any data source, provide seamless data delivery, and ensure the user experience is consistent and engaging.
I cannot stress the importance of this, especially if you are considering embedding dashboards and/or reports directly within business applications or within websites. The ability to build, share and view powerful, interactive, web-based data views that work seamlessly with your existing infrastructure will exponentially enhance your users’ ability to explore data by giving them a better BI experience. It will also increase user adoption, reduce the learning curve – less money spent on training – and ensure better access control, management, security and governance. What more could you want?!
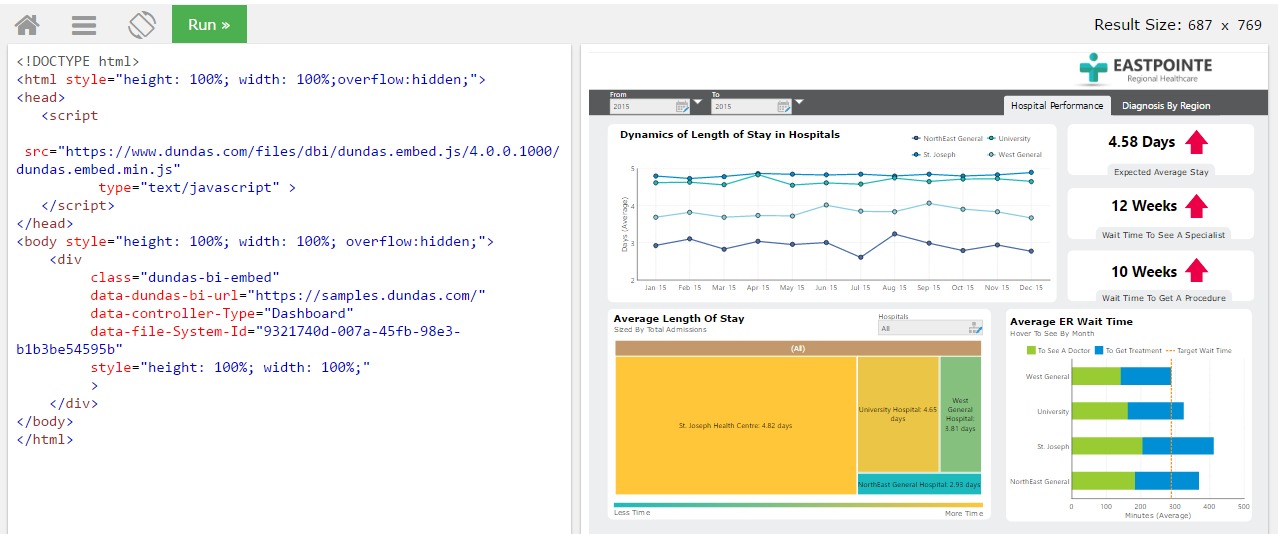
Figure 3 – Example of a Dundas BI dashboard being embedded seamlessly in a website
4) Immersive Mobile Experience
In 2016, the percentage of web traffic consumed on mobile devices eclipsed that of desktops for the first time ever. In 2018, in the United States, 58% of nearly 1 trillion web visits came from mobile devices. These numbers shouldn’t come as a surprise to anyone anymore; the shift from desktop browsing to mobile has been evident for a number of years now. What is surprising, however, is that a large chunk of business intelligence software does not offer its users an immersive mobile experience, meaning users are not able to create, view and share data views seamlessly or perform advanced data analysis on mobile devices.
Businesses are ever being tasked with making faster, better, more accurate decisions. One of the best ways for them to accomplish this, is by empowering them to provide a seamless user experience by making sure business intelligence systems are available and accessible from wherever their users are. Yes, this includes on their mobile devices. Your users aren’t glued to their desktops and neither should their analytics be. They are always on the go, so the ability to stay connected to their data from wherever they are by allowing them to connect, interact and analyze data from any device should be a no-brainer.
To ensure users are able to explore their data on mobile devices, it’s important to evaluate BI software that’s built with mobile in mind, preferably using HTML5, and does not require the addition of any special applications or downloads. Business intelligence software the works and looks on mobile devices like it does on desktops means users can design dashboards, reports and perform data analysis whenever they want, wherever they are, without being reliant on their desktops.
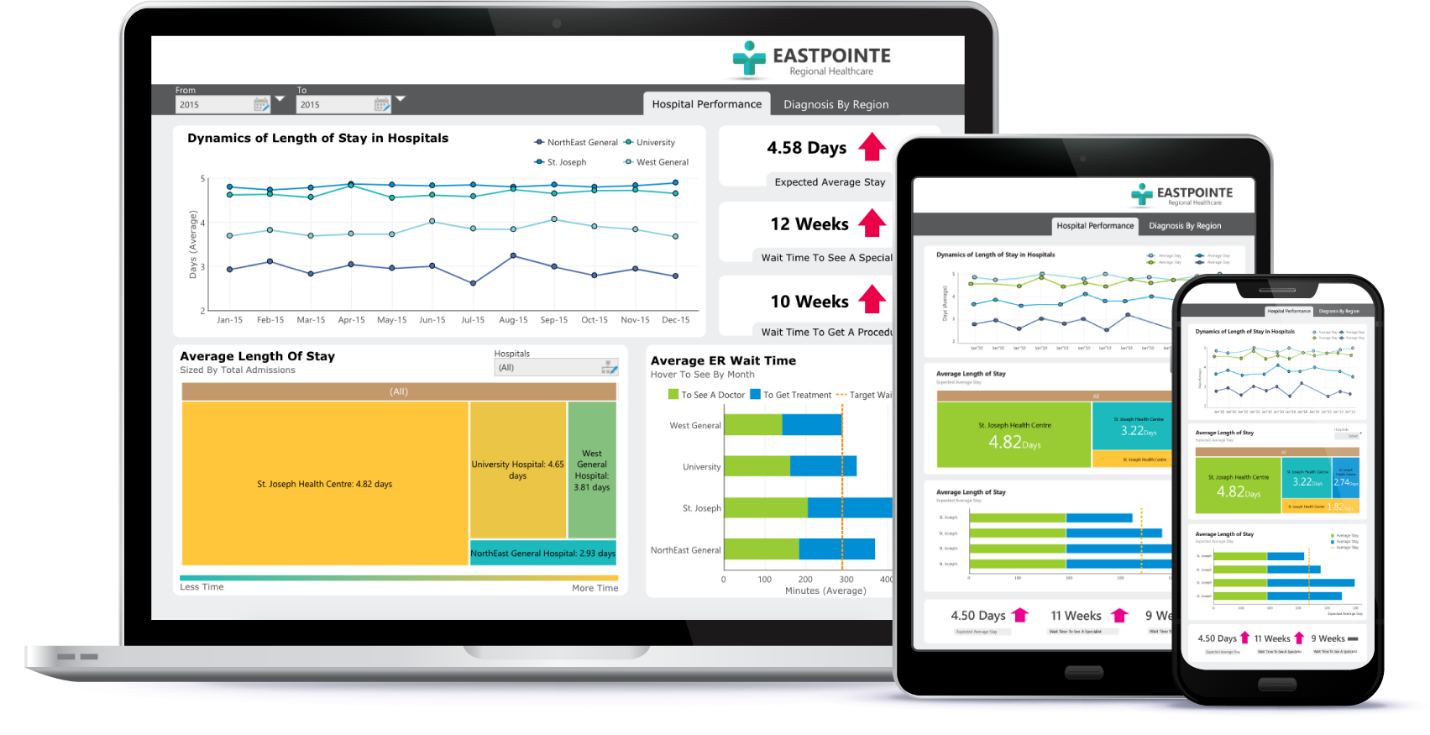
Figure 4 – Example of how a Dundas BI dashboard can be made to be responsive
5) Tailored Analytics
Tailored analytics – or what we sometimes refer to as adaptive analytics – is the concept of users experiencing and interacting with their business intelligence software in a highly personalized format. More often than not, tailored analytics results in users being able to more quickly realize the business value of their data through predictive and advanced data analytics and on-the-fly data analysis.
Here’s how the thinking goes. The more people you have within the business using analytics and making decisions based on data, the smarter and more successful your business will be. So, to achieve that type of data-forward culture, one where every user – regardless of their role – is consuming and exploring data, a business intelligence software needs to provide personalized, easy-to-use analytics experiences that operate precisely how its users except it to. By tailoring its output to different types of users, the BI software is effectively giving everyone the power of analytics, without compromising on functionality.
If you have many different types of users within your business – C-suite executives, business analysts, developers, etc. – make sure you evaluate BI software on its ability to address and adapt to each individual’s needs and to deliver an analytics experience that makes it easy for all of them to extract more value from their data. In doing so you will enjoy a higher ROI, slash any helpdesk support or training costs you might have incurred as a result of less technical users using the software, and ultimately have more people consuming and acting on data.
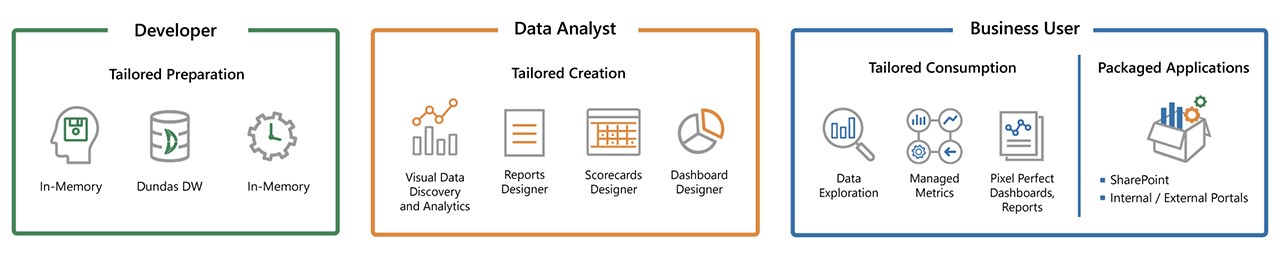
Figure 5 – Example of how Dundas BI personalizes every user experience
6) Secure, Governed Deployment Capability
Far too often do we see multiple departments operating independently from one another, using siloed data and local copies. This makes for poor inter-organization collaboration and fosters what I like to call the ‘Gotcha!’ Culture. The Gotcha Culture is one in which everyone makes decisions based on their own data and experiences and uses their findings to not only support their decisions, but simultaneously invalidate the decisions their colleagues make. When there is no single source of the truth, there tends to be a lack of alignment internally, and the business is more likely to stagnate despite its best efforts at growth.
To prevent such events from occurring, you’d be wise to evaluate business intelligence software that positions itself as deployable for modern enterprises. What you want to look for is software that allows you to easily deploy and manage secure, governed data analytics solutions according to your organization’s IT standards and keep everyone aligned. That’s a mouthful, but what we mean by that, is to evaluate BI software that can be deployed and managed how you want it to be – you’re in charge here, not the software. So, if you’re leaning towards deploying on-premises or in the cloud, just remember the choice is yours and the software you evaluate should be able to do either.
Whether you choose to deploy behind your firewall, on a Public Cloud, or using a combination of the two, look for business intelligence software that simplifies governance and maintenance processes, and allows you to easily track usage, monitor performance, ensure system health, manage content publishing, and leverage integrated version control. Everyone will thank you.
Your holy grail awaits
In order to solve real business problems, you need a business intelligence software that provides exceptional data exploration capabilities. Make sure you look for that small sampling of BI vendors with immense flexibility, smart, interactive data visualizations, open APIs, and rich, full-fledged BI capabilities for effortless data analysis. Use a critical eye and evaluate to see which best fits your specific use case.
Follow Us
Support