
Cycle plots are an elegant visualization, and, in my experience, very few people have even heard of them. This visualization can be used with any trend data and helps you understand how your data is trending across individual data segments. These segments might be a half year, quarters, months, or any cycle that repeats in your data. Usually, this visualization works best with time-based data, but I am sure some creative exceptions are out there.
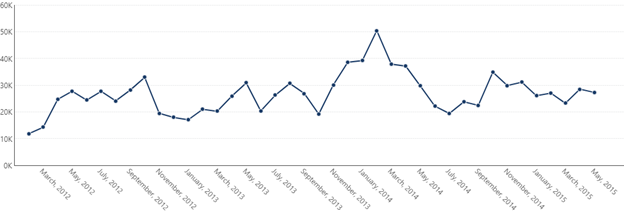
Let us start with the problem that the cycle plot chart type solves. Look at the chart below and answer one simple question for me. How is January trending?
Questions like this are very annoying to answer because of the way that data gets presented chronologically. You would have to move your eyes between each point and picture the shape in your head. I do not know about you, but I cannot take in this type of information and reorganize it in my head to answer a question like this very quickly.
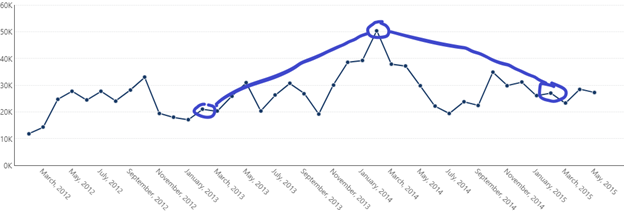
To answer this, you would almost have to go through each month one by one and circle each unique month to see the trend. A chart like this would be a requirement to see how January is trending.

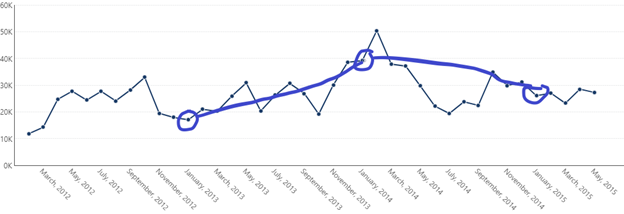
If you wanted to understand the variability of each month or maybe which months have your highest and lowest variance, you would have to do this for every month. It is just not practical to create February to December and compare them side by side.
Here is where the cycle plot comes into play. The cycle plot is a chart type that re-groups your data for each given ‘cycle,’ in this case, months. We show each month and then all the years one by one. The result will look something like this with the addition of the black lines to reveal the high and low points of every given month.
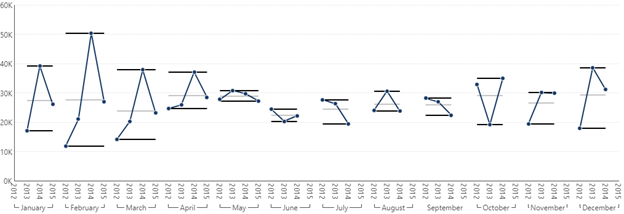
Our original question of ‘How is January trending’ is quickly and easily answered by looking at the January block in isolation and reading just like you would with a simple line chart.
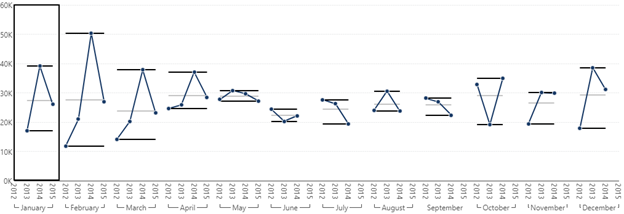
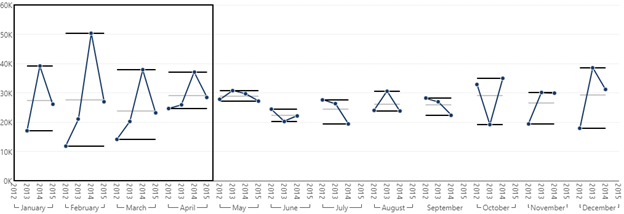
Now we can very clearly see that there are patterns to our data at the month level. January to April seems to swing a bit more wildly.
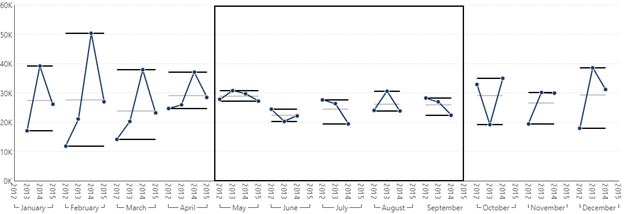
At the same time, we can see that May to September is much less volatile months.
As you can see, the cycle plot is a great way to see trends in your data that are not obvious with a standard line chart. In a Business Intelligence tool like Dundas BI, you can even display the data using a layer to allow users to toggle between the visuals. The ability to toggle will let your users explore patterns in their data that they might have never know existed.
About the Author

Jeff Hainsworth is a Senior Solutions Architect at Dundas Data Visualization with over a decade and a half of experience in Business Intelligence. He has a passion for building, coding and everything visual – you know, shiny things! Check out "Off the Charts... with Jeff", his platform for great content on all things analytics, data visualizations, dashboards, and business intelligence. There’s something for everyone!
Follow on Linkedin
Follow Us
Support