The biggest value of data visualizations is the ability to see insights in your data that you cannot see otherwise. For example, observing data changes over time allows you to gain insights on past behavior in your data and make decisions based on it.
A common method of seeing these changes is to use a filter on your data that allows you to select different values and see what the data looks like at that point. This is good if you want to see point-in-time behavior of the data. However, this does not really provide you with an analysis of how the data has actually evolved over time and a context of how data got to that point. This is where data storytelling comes in. As the name suggests, it is used to tell stories with your data and make your audience understand how and why they got there and inspire action and/or behavioral changes.
Take a look at the following example from Hans Rosling’s lecture, “The Joy of Stats”, where he tells the story of how the world we live in has changed over time by comparing the progress of different countries in terms of their average income and lifespans, and how different events in their history impacted them.
As Rosling narrates what is happening in the chart, you are able to follow the changes and make sense of it all. You can see towards the end of the video how the gap between the developed and underdeveloped countries is closing and the world is converging in the same direction.
In many cases, storytelling is done via slideshows created in different tools with the most common one being PowerPoint. For example, in Dundas BI you can tell stories with your data using Dundas BI’s native Slideshows feature. Slideshows in Dundas BI allow you to present insights using a series of live interactive data views that tell a logical business story using dashboards, scorecards or even notes right on top of your data visualizations. This is a great way to make your point, engage the users and encourage behavioral change by providing these informative views. You can go here to learn more on how to set up Slideshows in Dundas BI.
Animating your data changes, as in Rosling’s video, is a great way to enhance your data storytelling. It’s great for when you want to showcase trends or look for patterns in your data since you can click on the "Play" button and just explain how data is evolving by telling the story behind it.
It's also useful when showing your dashboards and reports without having to click every time you want to change the values of a filter, making it ideal to be used for dashboards on wall mounted displays.
Here’s an example of a chart that shows how the data changed over the course of one year for different countries this company’s products are sold in:
This chart was created in Dundas BI using a Play Axis filter. You can see from the animation that things were consistent until August, however, the gross profit for Canada and US dropped significantly between July and September. This gives you an indication that something drastically changed in the months leading to those months and will prompt you to investigate further. One other interesting observation is that Australia has always maintained a positive profit margin throughout, showing that it was a stable market during that year.
Here’s an example of how these data changes can be applied on a full dashboard. Let’s say you need to see the sales performance over time and want to know which territories have been consistent and which ones have not. By clicking the play button on the Revenue by Region (Top 10) chart, you can see that the market that has always been consistent in terms of performance is Texas, closely followed by Pennsylvania and California.
While animated charts are great for storytelling, this method is not probably not the most effective when it comes to exploring data. As Stephen Few points out in his post, this method is good for telling a story once its known, however, it’s not effective to discover the stories on your own. There are too many data points to follow and we cannot tend to more than one data point at a time and the animation needs to be run over and over in order to make sense.
That being said, some exploration can still be done using this method to identify patterns in datasets which are difficult to observe otherwise. To illustrate this point, consider the chart below, which shows fertility rates over the course of different years for different economically developed regions of the world.
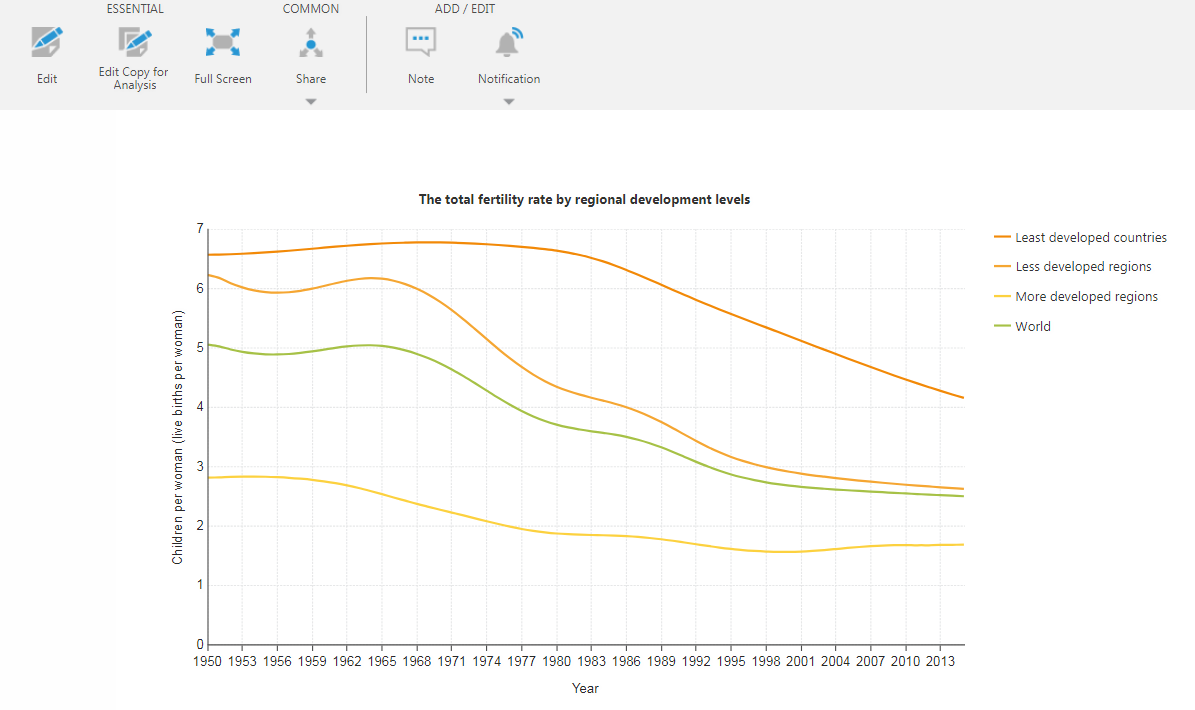
Figure 1: Fertility rate through the years
This chart was created in Dundas BI using data from the UN Population Division and is used to analyze the changing global population through different years and its impact on the future. You can see from the above chart that since the 1970s, fertility rates in the less developed regions of the world are falling rapidly. The reason behind lower fertility rates can be attributed to lower child mortality, higher incomes, the education of women, and the availability of contraception. You can read more about this here.
How did this fall in fertility rates affect the population growth across different countries over the course of time? Take a look at this animation that shows the Population growth rate vs the Child fertility through the different years:
You can see from the above animation how changing fertility rates over the years has affected the population growth of different countries. Data was very scattered in the early years but as time progressed, the data became more clustered. This is likely due to the changes described above along with the overall trend of lower fertility rates and lower population growth rates. This pattern becomes quite noticeable when using this animation.
Note that while each point in this chart represents a different country, labels for those points were hidden on purpose to allow you to focus on the overall pattern rather than on an individual country (point), which will be hard to do with that many points on the chart.
While this type of interaction is most commonly used with point charts and bubble charts animated over time, there are other possible use cases for this interaction. For example, you can use the Play Axis filter on categorical data as well. In this case, users can make selections either manually or by using the Play button. Due to the linear view of this filter where the different filter values are connected by a straight line, it may make more sense if the categorical data itself changes for values that progress and have a natural connection such as different Age Groups ordered by age. For example, the chart below shows what customers under different age groups bought the most. The Play Axis filter is connected to the Age Group and users can select the age groups they want to see. You can see the changing buying habits as the customer profile ages.
In this case, the filter’s Play button has been disabled to prompt users to manually make the selections. In Dundas BI this can be easily done using the Enable Play/Pause setting in the filter properties.
Conclusion
As you saw from the above examples, using the Play Axis filter is a great way to tell a story by animating the data changes to reveal trends and provide insights to your users. It can also be used to reveal overall patterns in data using a simple click.
Try it out with your own data and see for yourself!
Follow Us
Support