Rejoice! It's football season. Learn how to create a fantasy football dashboard ...
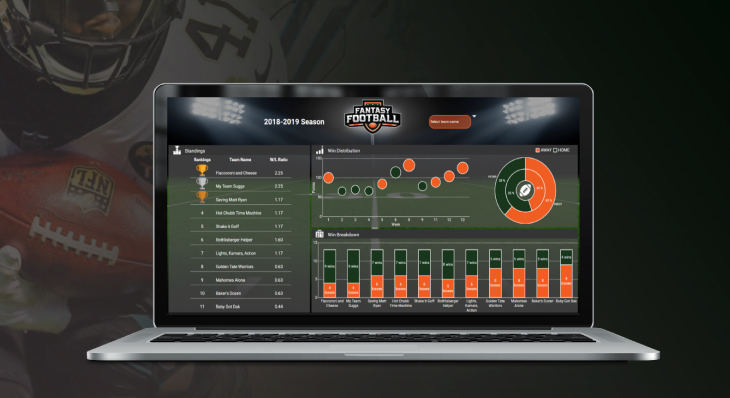
Rejoice! It's football season. Learn how to create a fantasy football dashboard ...

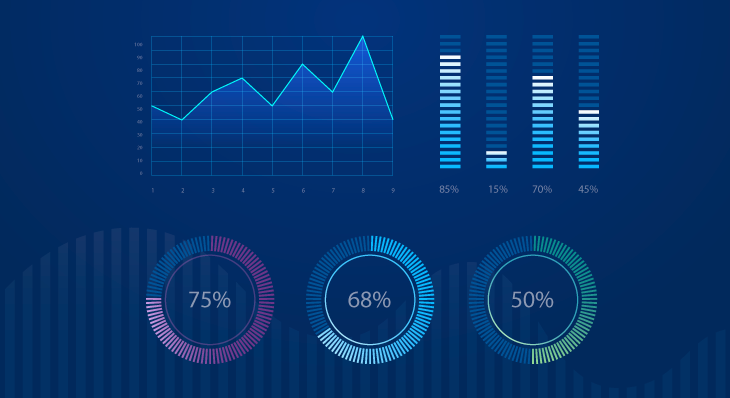
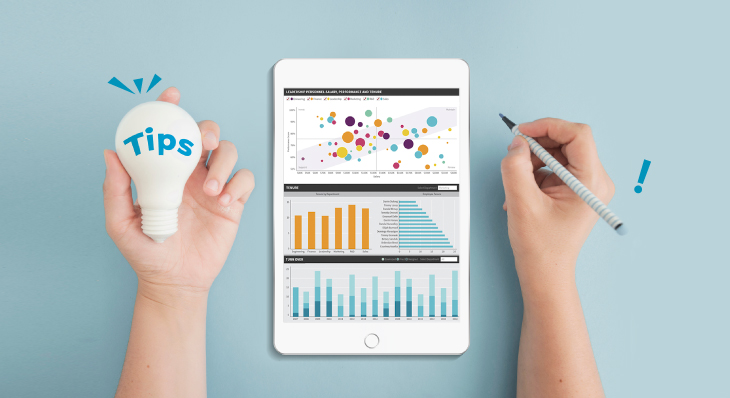
5 data visualization best practices you need to follow if you want to create meaningful da...
Use animations to make interactive data exploration and analysis as intuitive and effectiv...

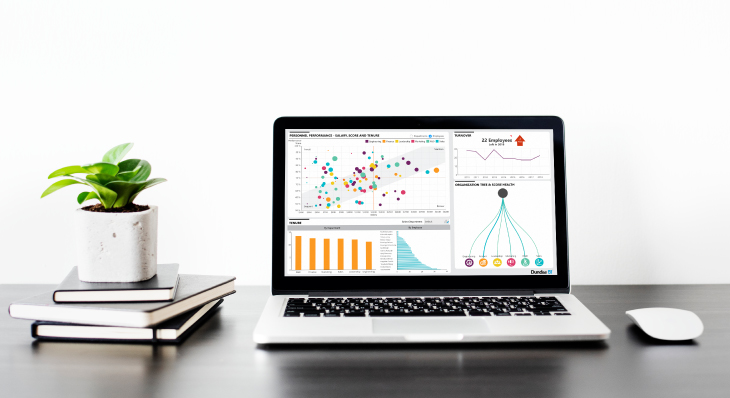
To ensure your Business Intelligence project is a success, I’ve outlined 8 common mistakes...
Performance optimization of dashboards is a hotly discussed topic. Let's talk about the co...

There are ways to make data and business intelligence more palatable and ultimately increa...
When creating fully-fledged dashboards – you know, the ones we pour our heart and soul int...
Tips and tricks to make your dashboard development in Dundas BI as efficient as possible.<...

One great aspect of Dundas BI’s user interface flexibility is its full exposure to the und...
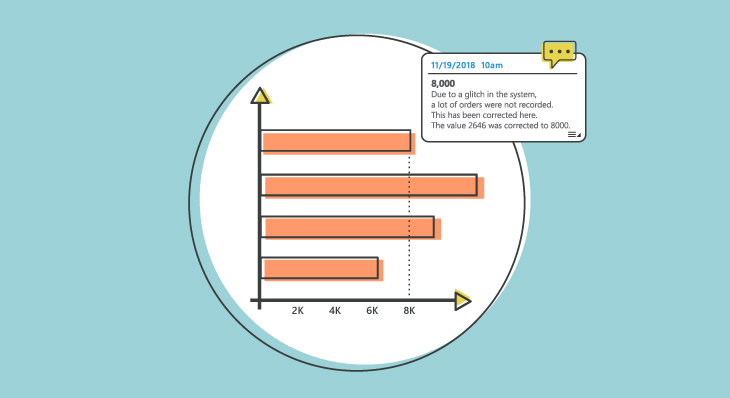
To get away from side discussions occurring in 3rd party tools, the conversations need to ...
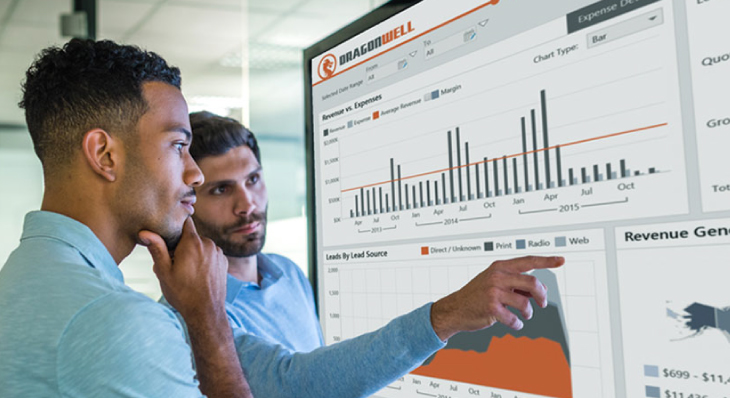
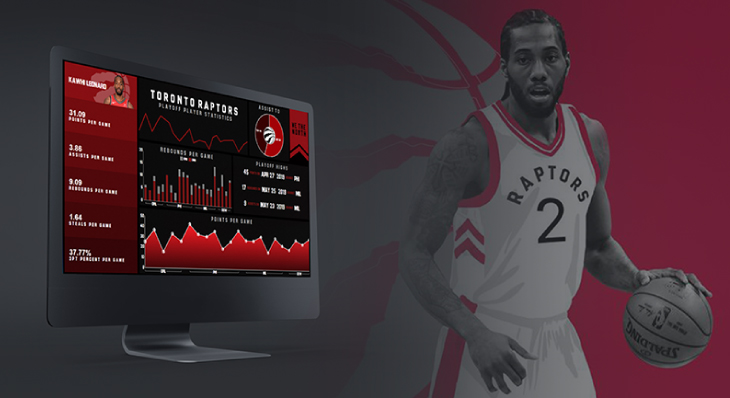
Wall-mounted dashboards are a great way to ensure key business metrics and analytics are m...

Heat Maps are graphical representations of data that utilize color-coded systems. What man...
Follow Us
Support