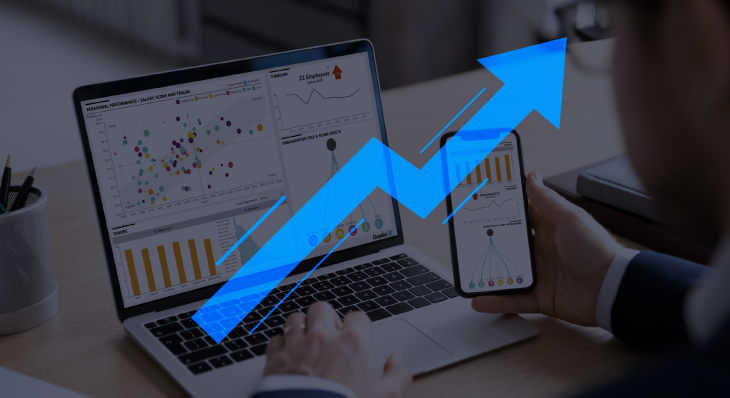
Whether it comes in the form of an interactive dashboard on your computer screen or a multi-page report on your desk, data helps to inform decision-making, uncover trends and insights, and even forecast the future.
But reporting has come a long way—and it’s a lot more user-friendly. In fact, these days, users can create their own reports, thanks to tools that offer seamless embedded reporting. This ‘democratizes’ analytics throughout an organization, making data insights available to all business users—not just data scientists and analysts.
The tools: Reports and dashboards
The words ‘report’ and ‘dashboard’ are often used interchangeably, though they’re not the same thing—and they’re often used for different purposes. A report is used for more detailed analysis of static data; it’s typically text-heavy, multi-paged and printable, and might contain charts and graphs.
A dashboard, on the other hand, is contained on a single screen and features concise, actionable data. It’s typically used for in-the-moment analysis of data to inform a specific business decision—sometimes in real time.
Not every modern business intelligence tool can produce both reports and dashboards with interactive visualizations and self-service functionality. Some tools on the market focus more on dashboards than reports, but a tool with both capabilities offers a wider range of functionality to a wider pool of both technical and business users.
Data is often easier to interpret through a dashboard, using visualizations such as a pie chart or bar graph. For example, a dashboard serves as a ‘canvas’ where users can drag and drop data elements to create data visualizations. Reports, on the other hand, are more like a ‘template’ where the data is filled in and keeps repeating until all the data is displayed.
The role of reports
Reports are often lengthy, spanning multiple pages, whether in a digital PDF or a physical report that’s been exported, printed and collated. The data in a report is often static, based on a snapshot in time, such as a quarterly or annual report.
Reports are ideal for displaying a lot of data in a fixed structure; they expand based on the data being displayed. Modern reports also give users the ability to add visual components. A pixel perfect report, for example, can incorporate maps, data images and other report elements.
The role of dashboards
Dashboards are designed to present specific data about a specific business objective, such as a key performance indicator, for at-a-glance decision making. Typically, all data necessary to make a decision is presented on a single screen using visual, interactive features. Modern BI tools that include both dashboards and reports allow people to drill down from a metric on a dashboard into a report for additional detail.
This avoids overwhelming users with data points, yet still allows them to drill down into the data where necessary. While not all reports are static, not all dashboards need to be highly visual or interactive; it depends on the purpose behind the dashboard.
Embedded reporting
Becoming a data-driven organization means incorporating data analysis into everyday workflows—and that includes the ability to create dashboards and reports. Embedded reporting allows users to view dashboards and reports directly in the business applications they’re already using, typically through the use of a white-label BI tool.
To ensure data integrity, the BI tool is connected to data sources with established parameters and frameworks. Users can then generate a dataset (such as a table with columns of data) without having to write any code—or without any experience in data science or analysis, for that matter—to look for trends, patterns or insights in the data.
Self-service functionality ranges from hitting an export button on a chart, to building and designing that chart from scratch. For example, users could change the parameters in a dataset to create a simple dashboard, or export and print the results, which they could then share with co-workers during a meeting or presentation.
Users should be able to embed any experience they want, from very simple to very complex. That means the BI tool should allow them to start with simple—especially if they’re new to data analytics—and grow to more complex experiences without having to switch BI tools.
The best of both worlds
Dashboards summarize data, making it easy to consume. But behind those summary elements is a whole lot of data. Users should be able to drill down into that data—without having to ‘drink from the fire hose’ to find the insights they’re looking for—to create the reports they need to see in more detail.
In some tools, reports can be interactive—just like dashboards—but they’re designed to be simple to view, export or print. When using them in conjunction with dashboards, users get the best of both worlds, and they can save time spent preparing regular reports (such as end-of-quarter or annual reports). Using both together in one tool can create efficiencies without compromising on the availability or integrity of data.
For example, in Dundas BI users can drill down from a traditional dashboard to get a more detailed view of the data. They can then build their own report by dragging and dropping items into the header, body and footer regions of a report template. Users can then switch to View mode to see the actual report. The BI and dashboard reporting tool in Dundas BI also provides specific capabilities that allow for automating the entire reports usage process, including email delivery scheduling, report bursting and printing.
Choosing the right tool
Different users have different skill sets and requirements, so a front-end BI tool that allows for different types of reporting in one place—rather than multiple tools that increase data siloes and inconsistencies—can help all users make the most of their data.
For example, a marketing exec might use self-service BI to drag and drop charts and graphs onto a personal dashboard with metrics on retention, referrals and return on investment—helping to save time and create efficiencies when strategizing on marketing campaigns.
Look for a tool that allows users to:
- Easily drag and drop data onto a ‘canvas’
- View and create different types of visualizations
- Combine multiple visualizations connected to metric sets
- Combine several dashboards into a more personalized view of data
- Create reports by laying out content onto multiple pages, ideal for printing or PDFs
Ultimately, having dashboards and reports available all in one tool will encourage users to adopt data analysis into their everyday workflows, gaining the benefits of business intelligence and accurate data-driven decision making.
About the Author

Vawn Himmelsbach is a writer and editor specializing in enterprise IT, writing for national newspapers and technology trade magazines on everything from AI to zero-day threats. She also spent three years working abroad as an Asian correspondent, covering all things tech.
Follow on Linkedin
Follow Us
Support