Rose Charts are a very niche data visualization and something that you may have never seen...
Data in Excel can be a formatting disaster, and there are specific guidelines you should f...
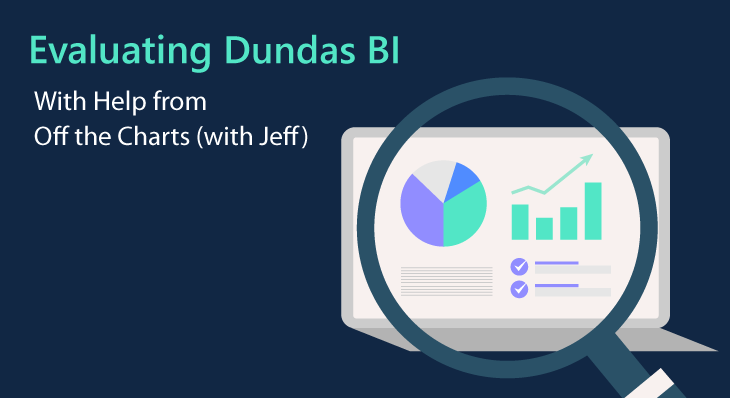
When it comes to evaluating BI and Analytics software, you are probably finding yourself h...
What is a metric set? Metric sets are a core concept in Dundas BI and are often confused w...
In this video, our trainer, Mark, shows you everything you need to know about States - wha...
If you're looking to take your first step into the world of business intelligence (BI), yo...
This video shows how you can embed your export capability onto the end-user content for a ...
Building an In-Memory Data Cube in Dundas BI can significantly increase your data performa...
There might be music in your data! In this video, we explore how to use Dundas BI to conve...
Data modeling is the tasks/activities required to prepare data before it can be used for r...
In this video, we cover some of the many ways that Dundas BI can be customized to allow fo...
Embedded Business Intelligence is the integration of reports, dashboards, and even self-se...
The map control/data visualization in Dundas BI is so extensive that it could very well be...
Learn the basics and benefits of multitenancy in Dundas BI
Use Dundas BI to create interactive dashboards using several techniques available to you!<...
Big data is the use of extremely large data sets that may be analyzed to reveal trends, pa...
Follow Us
Support