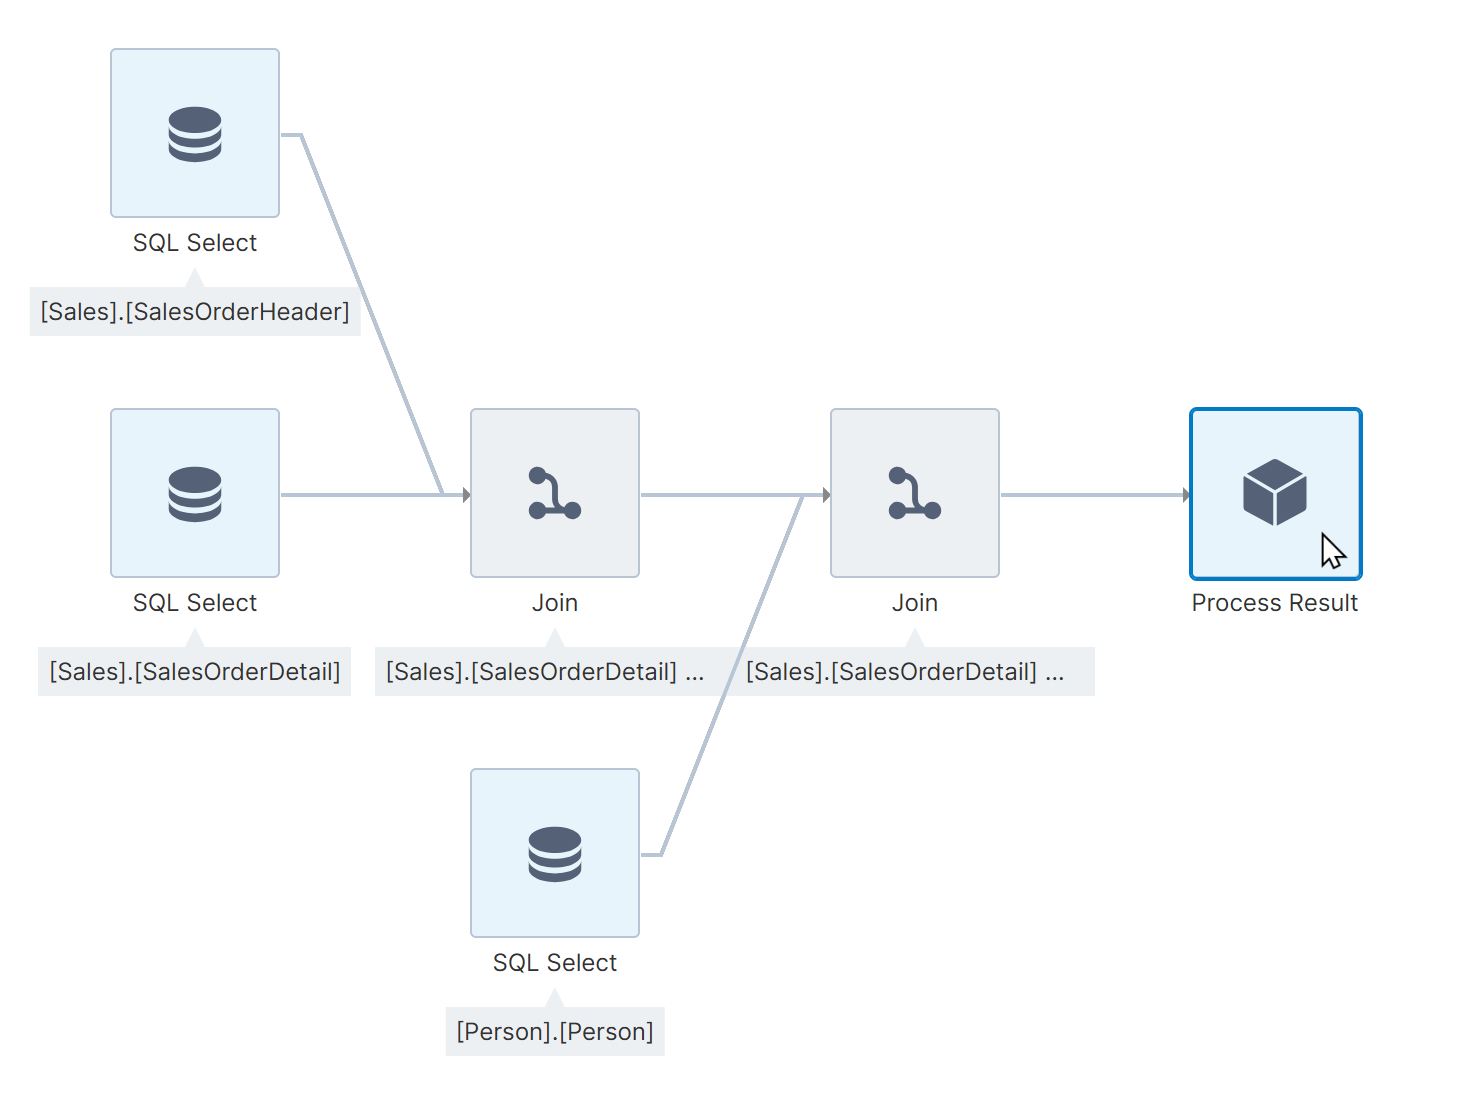
The Process Result transform represents the final output or result of the data cube (ETL process).
This transform doesn't do any data processing but it allows you to configure the measures and hierarchies that will be made available to downstream items such as metric sets.
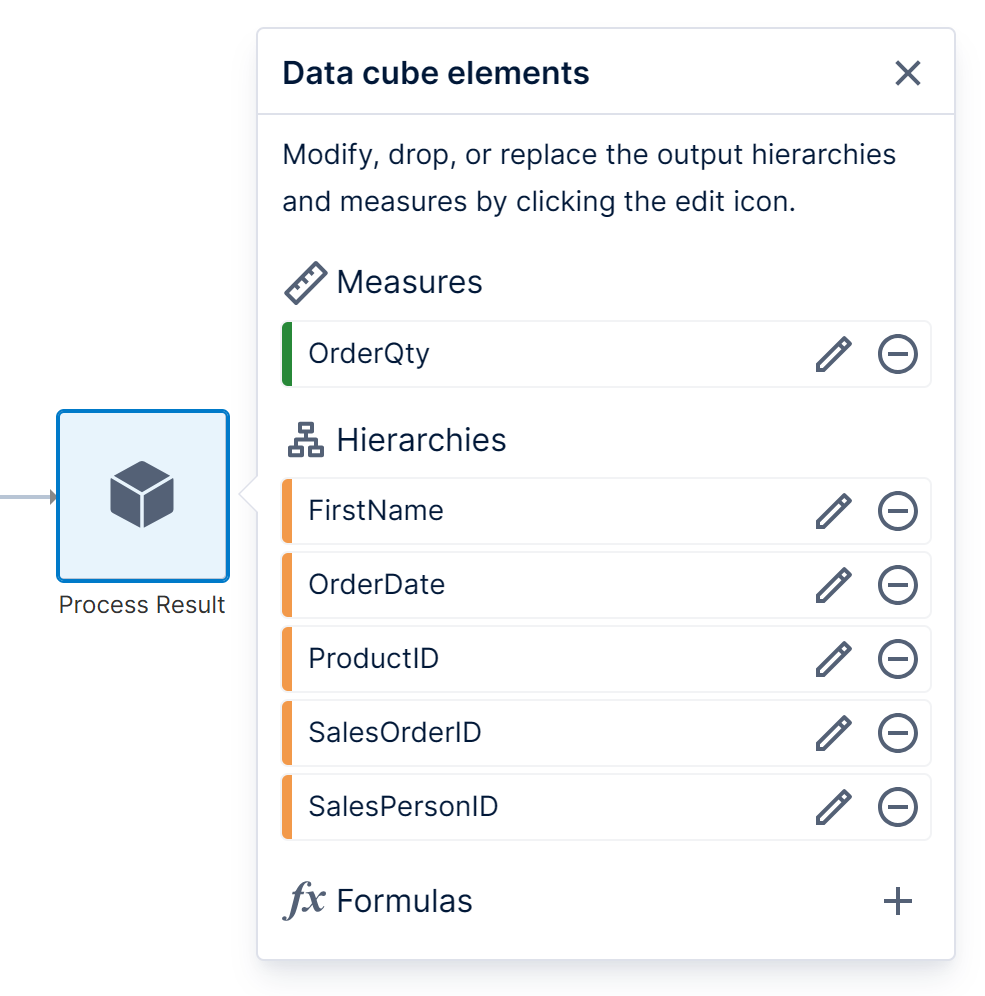
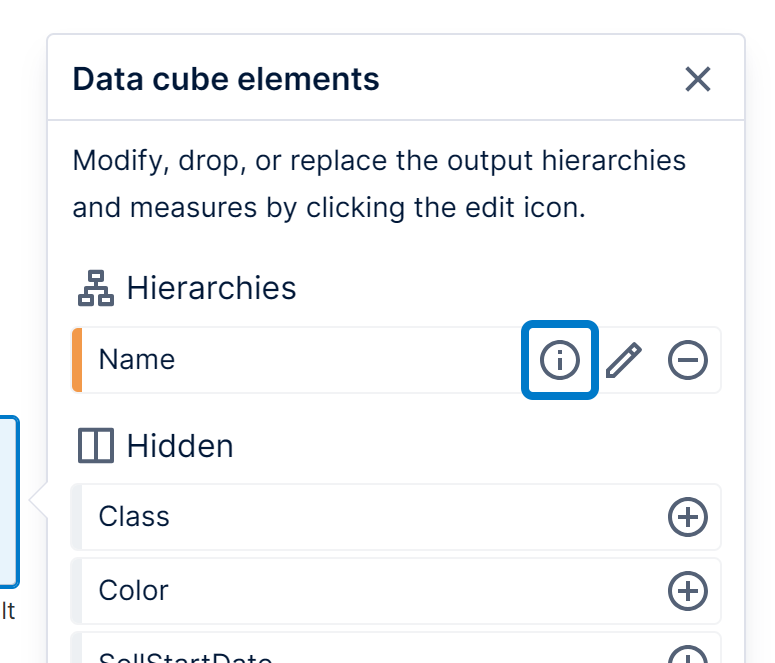
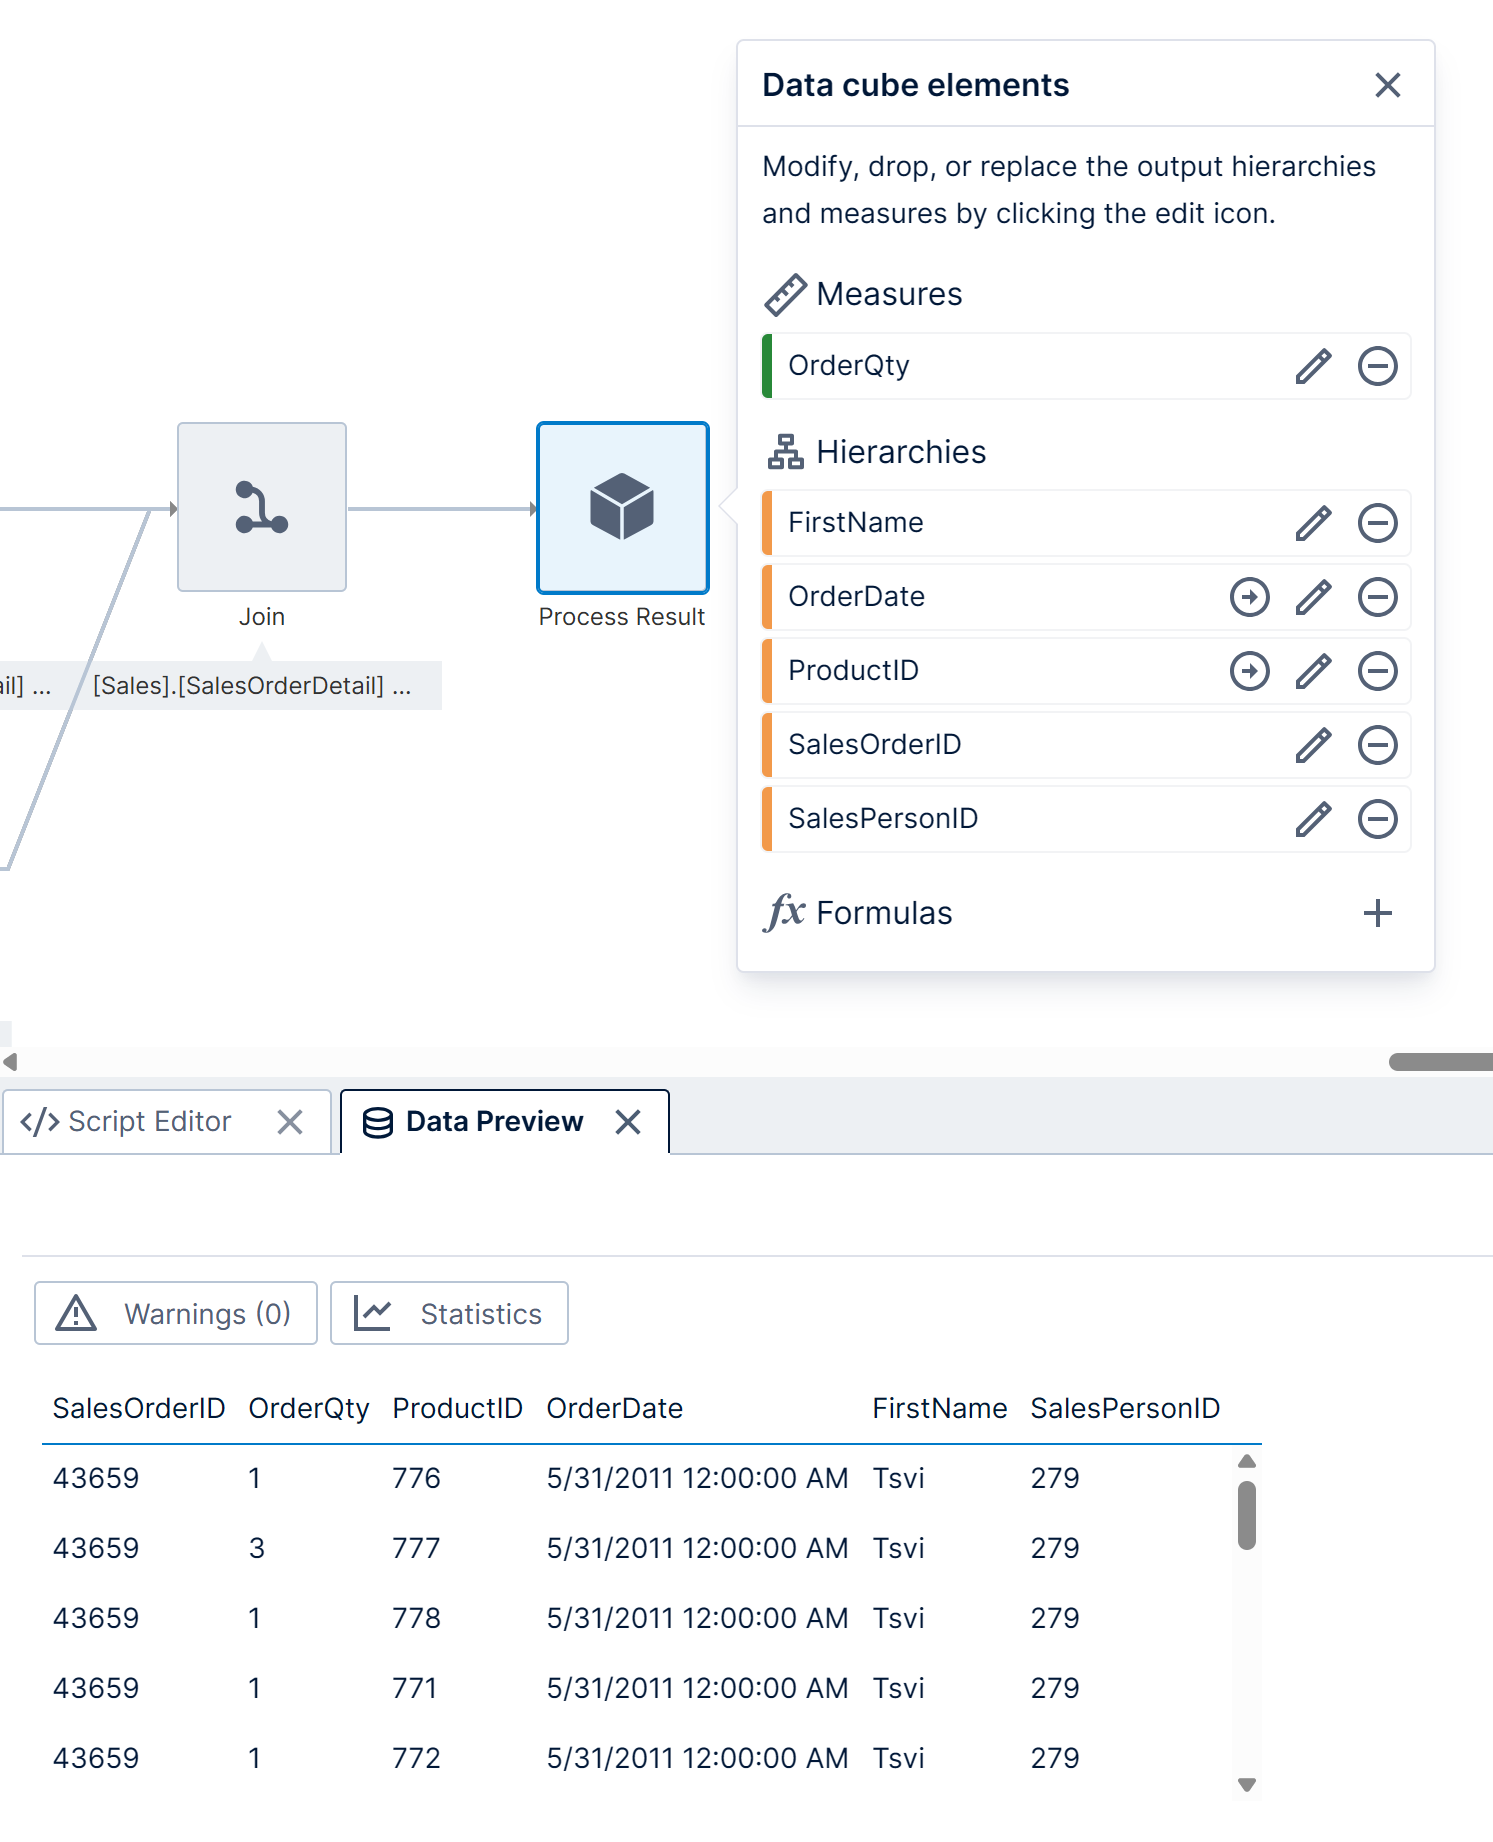
Click the Process Result transform once to see the Data Cube Elements panel, which lists the output measures and hierarchies for this data cube. Measures and hierarchies are color-coded the same way as in metric sets.
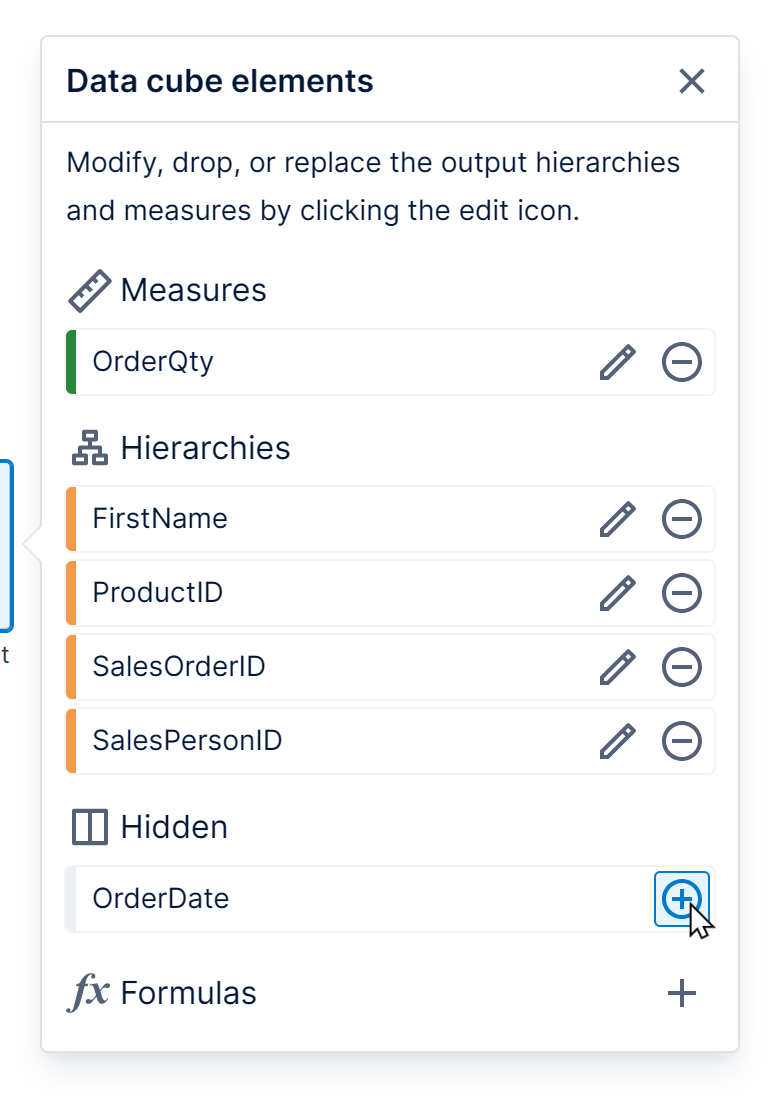
You can hide a measure or hierarchy from the output by clicking its grey minus icon on the right. The measure or hierarchy will be listed under a Hidden section where you can easily unhide it by clicking its plus icon.
A hidden measure or hierarchy is hidden from the data cube output but will still be available for subsequent linking in hierarchy keys (e.g., if you need to use the data cube later to define a hierarchy).
1.2. Edit elements
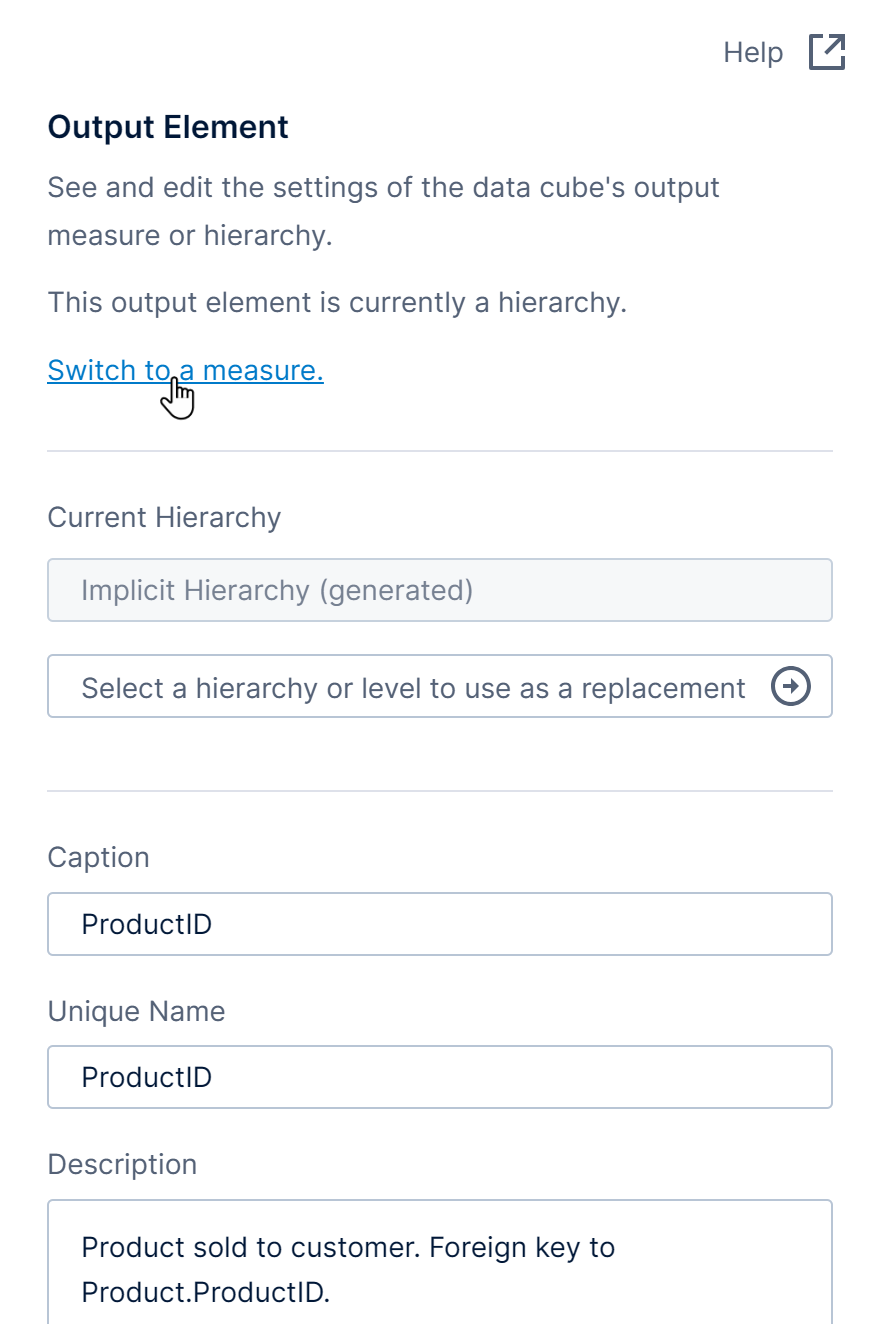
You can access additional options related to each measure or hierarchy by clicking its green or orange tile to edit it.
The Output Element dialog will open, where you can change the Caption, set a Description, and customize various settings including supported aggregators or a measure's number formatting.
For elements that could be either a measure or a hierarchy, you can click to Switch to a hierarchy or Switch to a measure. Non-numeric type data can also be switched to a measure in order to perform a count or distinct count of that element's values, similar to adding a hierarchy count measure in a metric set.
1.2.1. Replace with a hierarchy
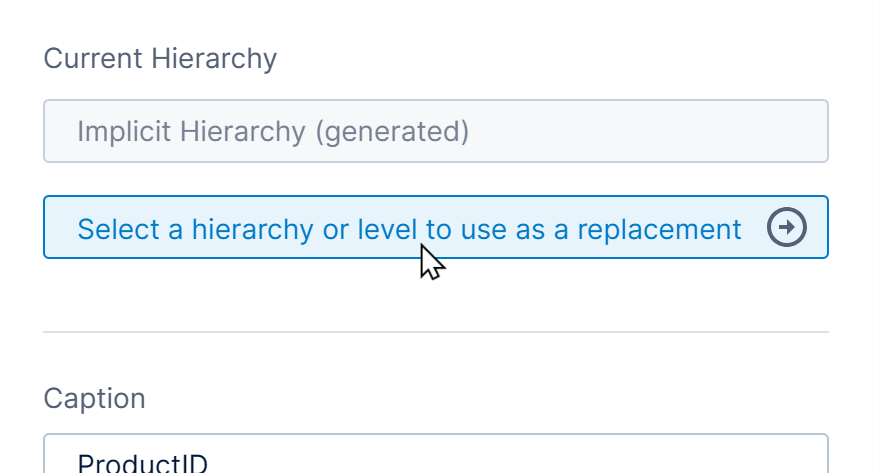
Simple columns of text, dates/times, or numeric IDs each automatically become an 'implicit' or generated hierarchy when output by the cube and used in a metric set. You can replace such columns with a hierarchy you've created and set up with features such as multiple levels and custom sorting, or with a time dimension hierarchy for date/time data. For example, you could replace a ProductID column with an existing multi-level Product hierarchy.
To do this, click Select a hierarchy or level to use as a replacement in the Output Element dialog.
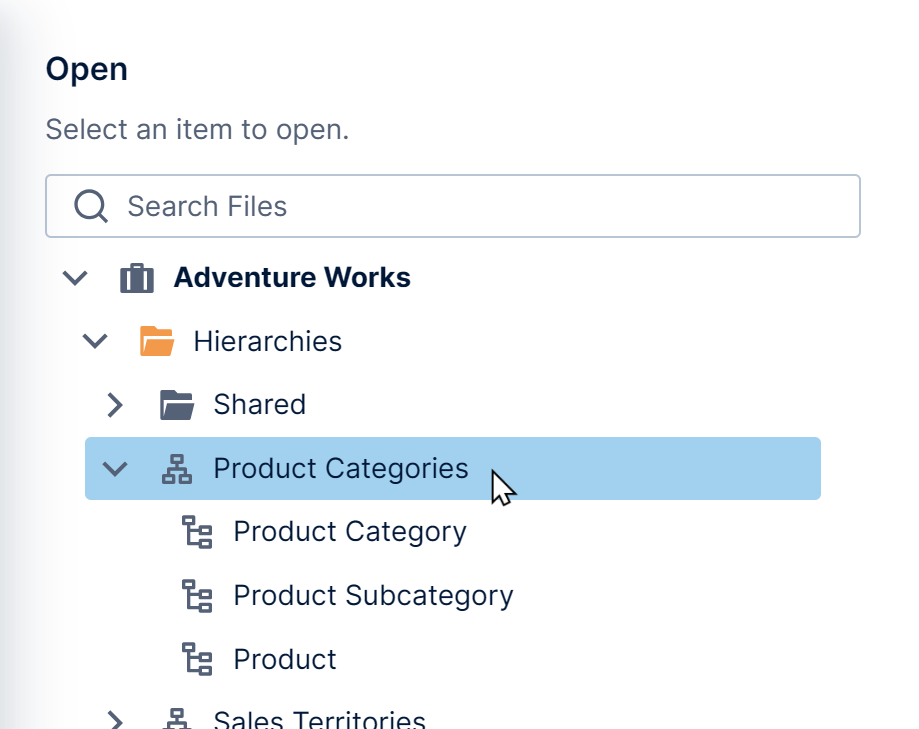
In the Open dialog that appears, select your hierarchy from the Hierarchies folder, or for time dimensions, click to expand one from the Time Dimensions folder and select one of its hierarchies.
Selecting the hierarchy will link the column to the lowest level of the hierarchy by default, or you can expand the hierarchy and select a specific hierarchy level instead. For text or numeric columns, you must choose the level with keys that were set up to match your column's values.
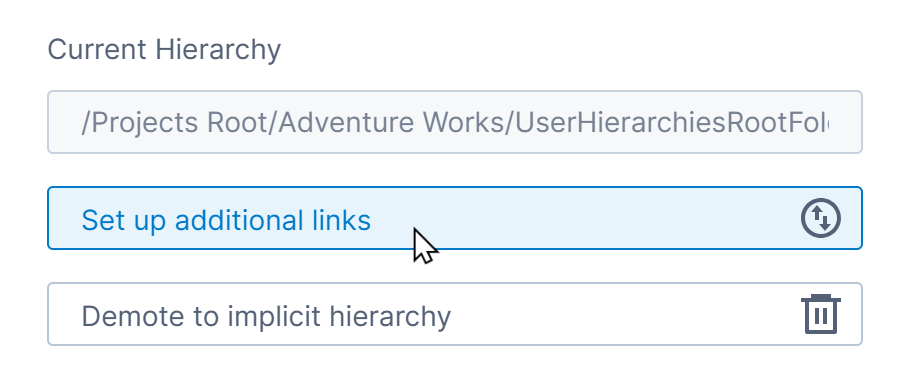
Returning to the Output Element dialog, you can optionally click to Set up additional links between the hierarchy and the cube's data at other levels if your data also matches with their keys, which can improve performance. You should also set up additional links if you chose a hierarchy level that has multiple keys so that each key is linked to your cube's data.
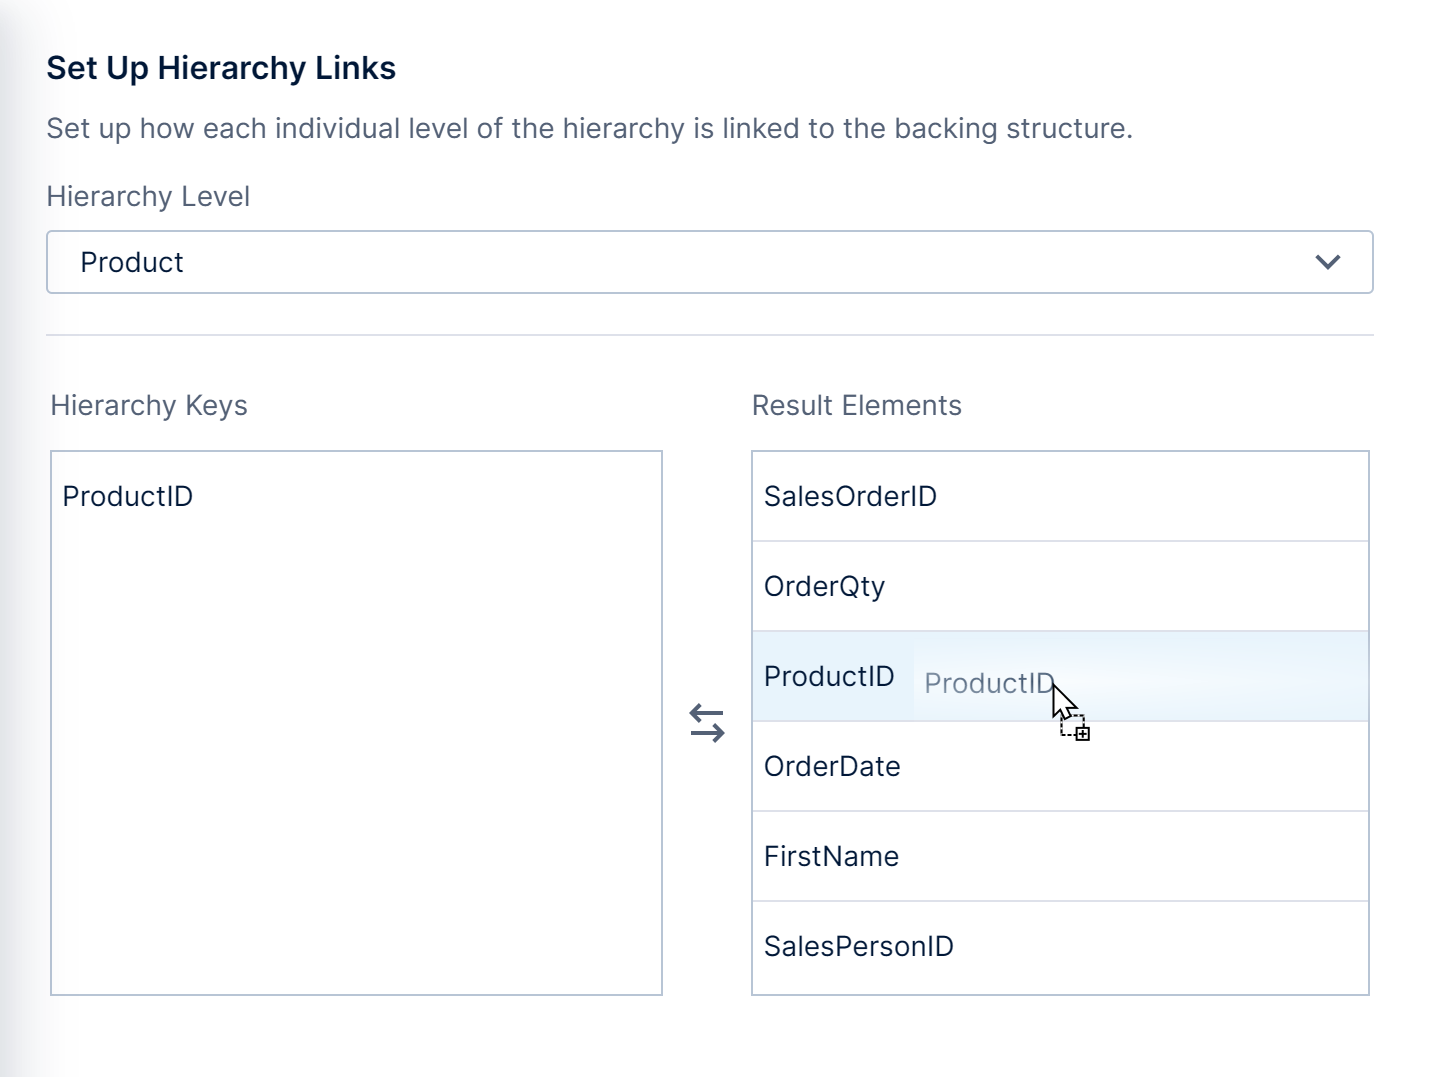
In the dialog that appears, select a Hierarchy Level from the dropdown. To add a link, drag an item under Hierarchy Keys and drop it onto the corresponding item under Result Elements.
The 'All' Member Caption can be set to customize the text identifying the top node of the hierarchy. If this value is not set, it will display the value located in the localization file for the current language.
Implicit date hierarchies used with a Calendar filter will use the caption from default time dimension.
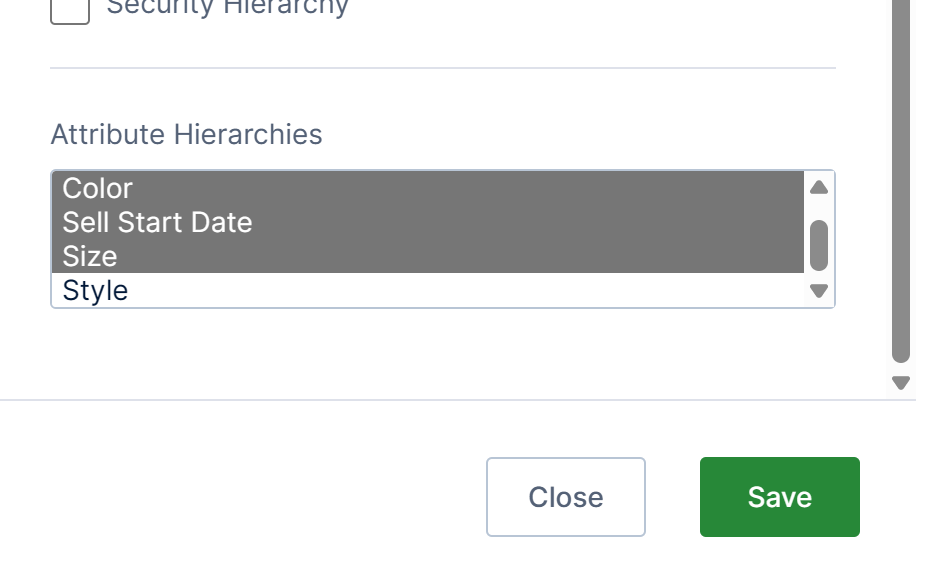
1.2.3. Attribute hierarchies
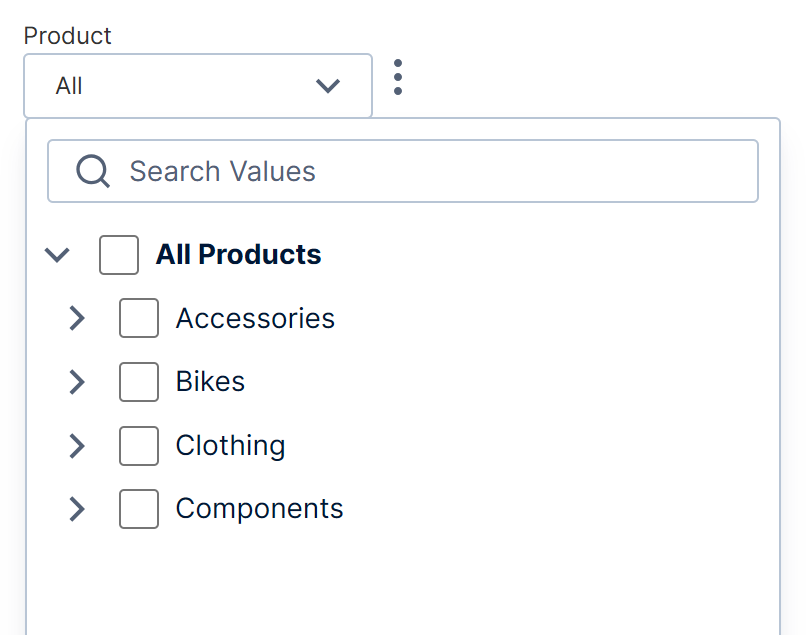
If the element is an implicit hierarchy, you can select other output elements under Attribute Hierarchies that should appear as attributes for this hierarchy the same way as attributes defined in a hierarchy created from the main menu.
To select multiple, hold the Ctrl, ⌘, or Shift keys or drag while selecting.
After saving your changes, the hierarchy with attributes defined will appear with a special icon in the Data Cube Elements panel, and the elements selected as attribute hierarchies will no longer be listed separately under Hierarchies.
The Anonymize Members option is available for implicit hierarchies (except for DateTime columns), and when enabled will generate a new value to replace each unique original value in the column so that it does not directly identify the original. The generated values may change over time.
The Security Hierarchy option on hierarchies allows you to accomplish row-level security by filtering the data by that hierarchy's values where they must match the custom attribute value for each logged-in user. For details, see Using a security hierarchy to filter data by user.
The Add column security button (Edit column security if previously set up) is available for all element types for setting up column-level security. Column security hides or replaces all values from this element or column for the users not allowed access whenever this data cube is used in metric sets or visualizations.
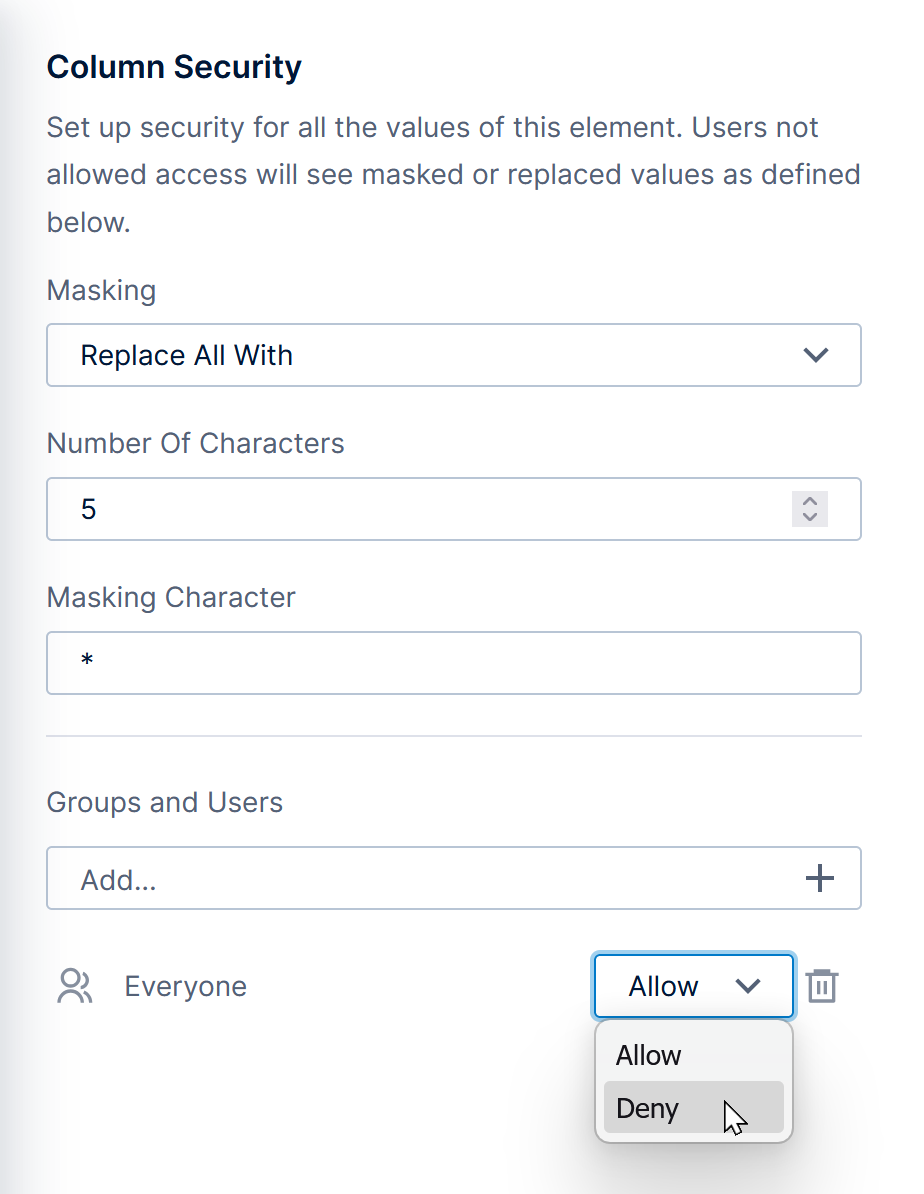
Column Security dialog In the Column Security dialog, a variety of options are available for how to mask or replace values for those users, which are explained in tooltips that appear when hovering over them. To determine who sees these masked or replaced values, under Groups and Users, click to Add them to the list and set their assignments to Deny, or change the default Everyone assignment to Deny.
Note
These security privileges are similar to file security privileges. For example, a user must be explicitly allowed access directly or via a group to see the original values, and any Deny assignment always takes precedence over an Allow.
1.2.5. Supported aggregators
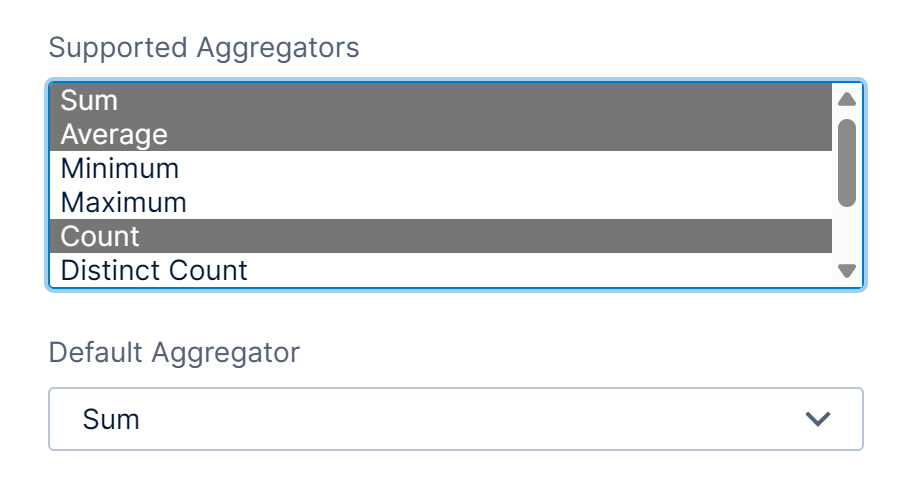
Both numeric data and non-numeric data elements have a Supported Aggregators setting, which determines which aggregators are available when this data is added under Measures in a metric set. To select multiple, hold the Ctrl, ⌘, or Shift keys or drag while selecting.
For measures, the Default Aggregator determines which of these is initially selected when first added to a metric set.
The number of available aggregators is a consideration for the amount of memory consumed when using in-memory storage.
You can drag a hierarchy to Measures in the Data Analysis Panel to perform a count or distinct count of its values, and the Supported Aggregators setting determines which of these two kinds of counts are available.
1.2.6. Formatting measures
The formatting options available on a metric set can also be defined ahead of time for a measure in a data cube, which will be the initial settings used when that measure is first added to a metric set.
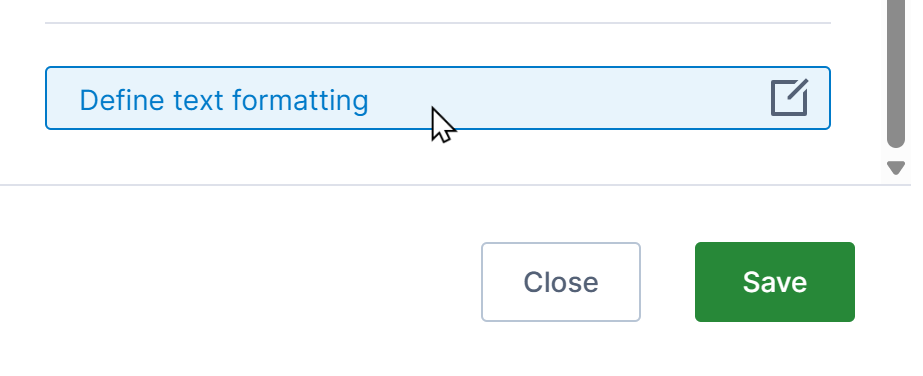
Click Define text formatting to open the Configure Formats dialog, which contains a variety of options for formatting numbers as text. For details on these, see the article Formatting text.
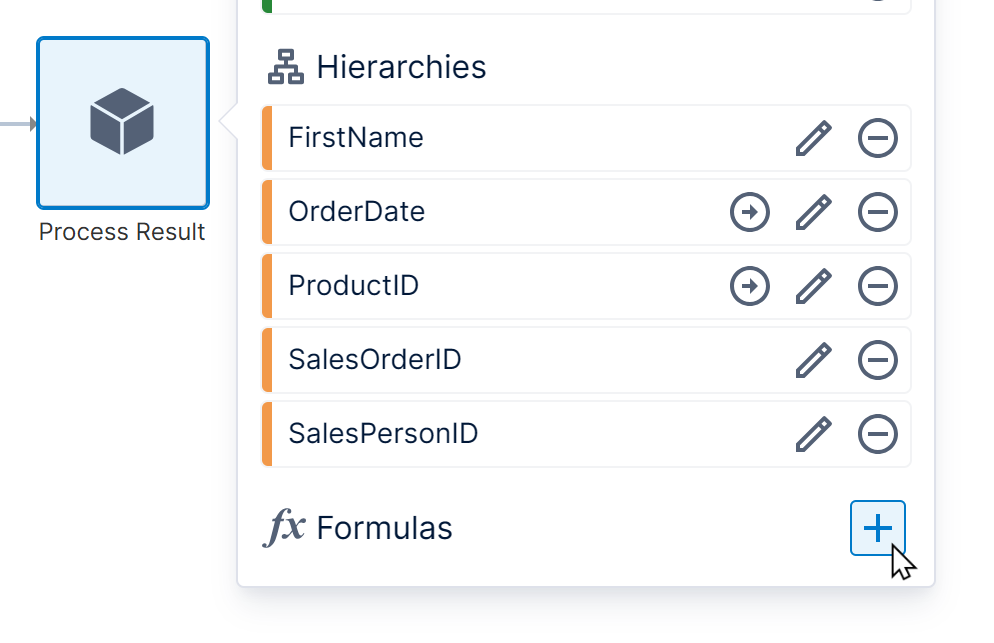
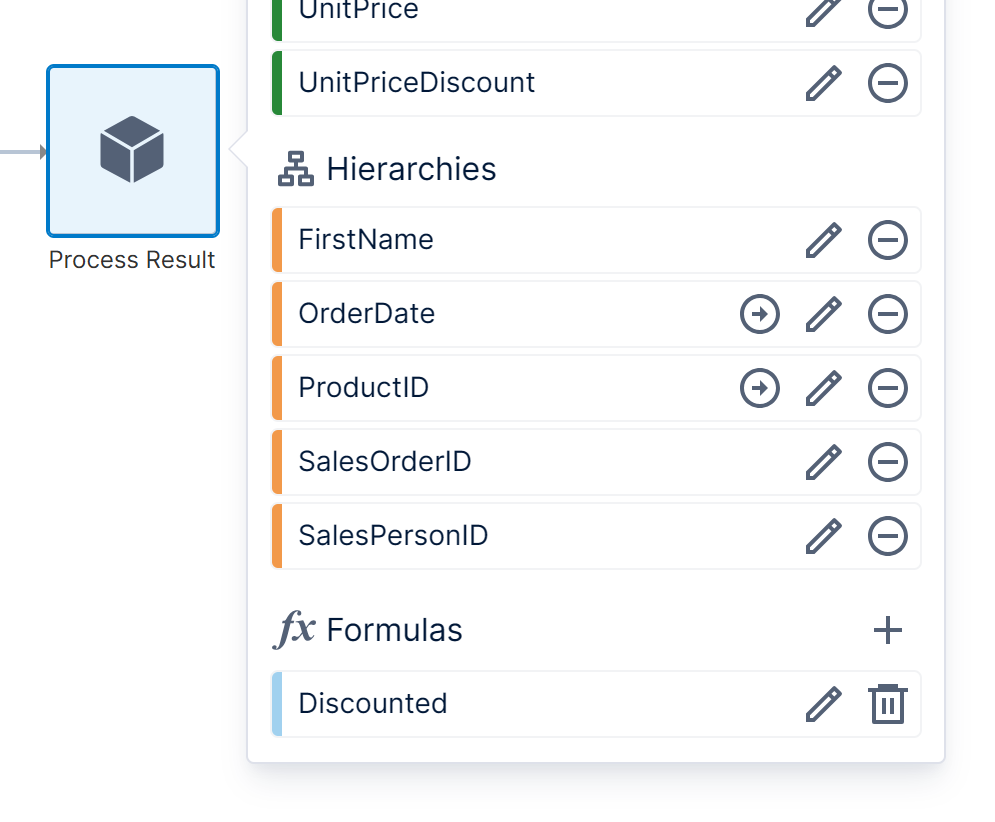
In version 25.2 and higher, you can click the plus button next to Formulas in the Data Cube Elements panel to add a formula expression to the data cube's output, which can then be used and reused in metric sets.
This an alternative to adding a calculated element to a data cube, and when added to a metric set it will instead process data after it is grouped and aggregated according to the metric set's selected hierarchies.
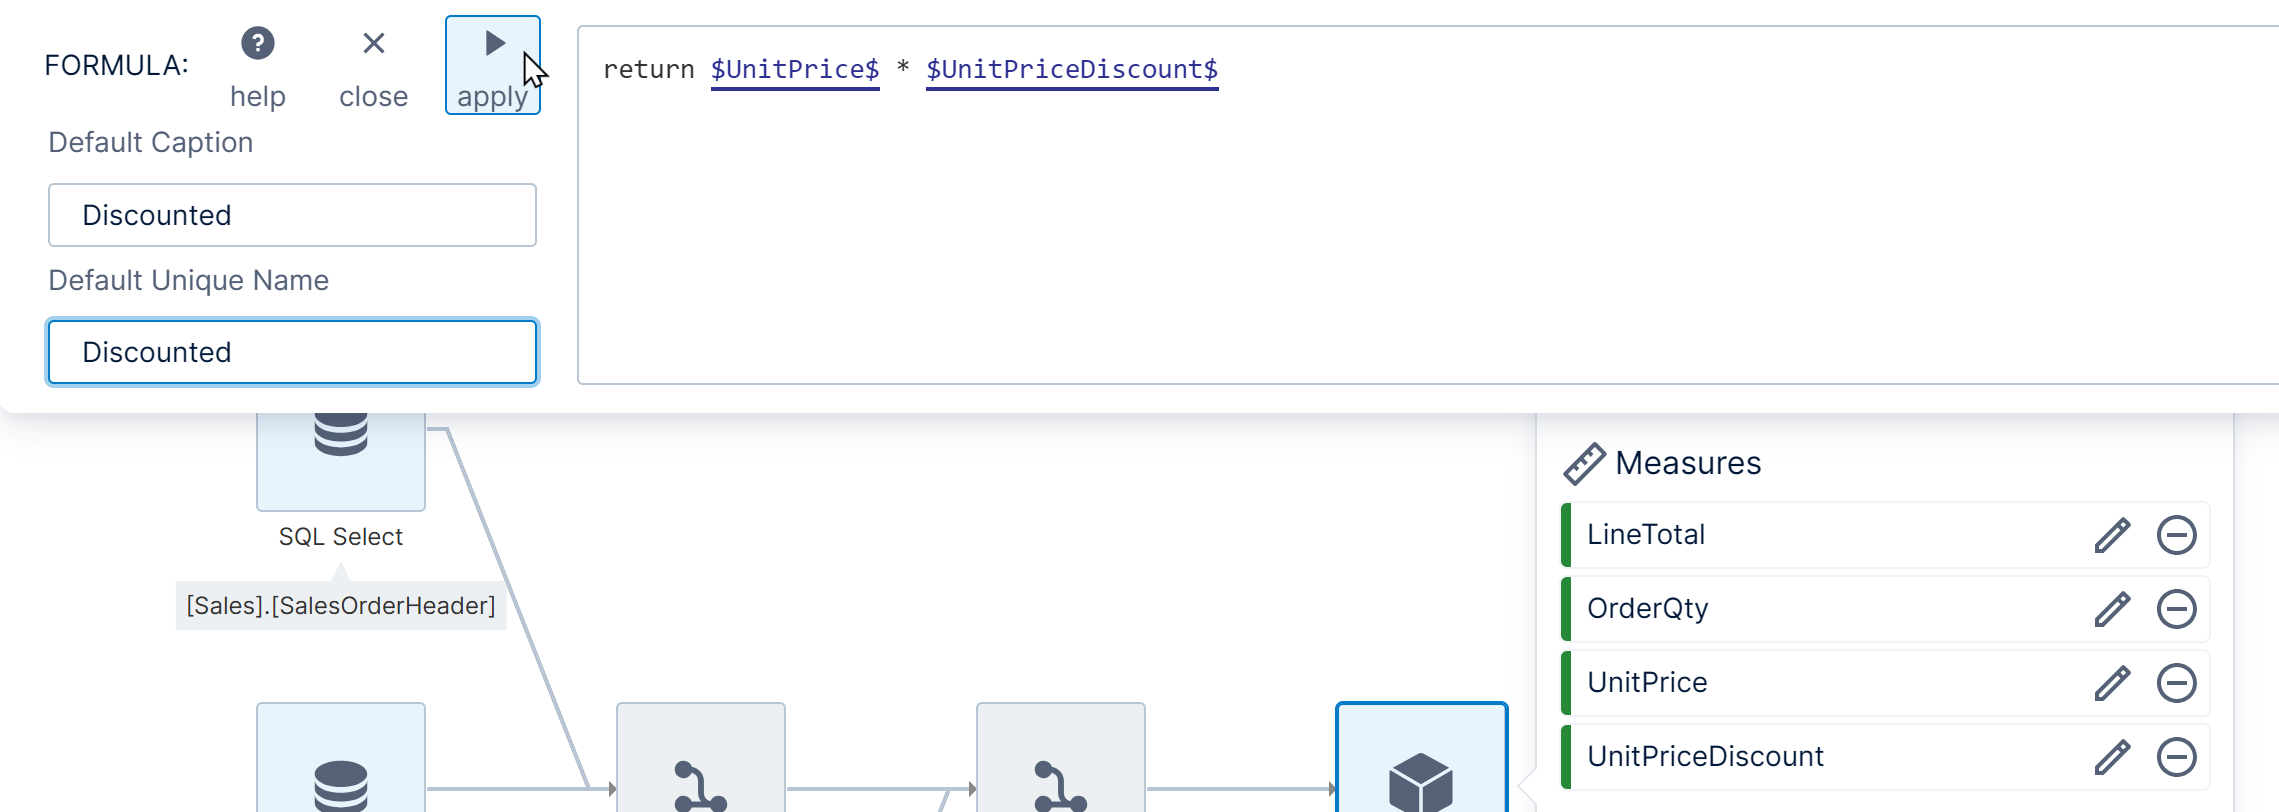
Adding or editing a formula from the Data Cube Elements panel will open the formula bar like the one used when editing a metric set, but it opens directly into advanced mode. Like calculated element expressions, advanced formula expressions must include a return statement.
Enter your formula the same way as in a formula expression or calculated element expression:
Refer to other data cube elements using placeholders. After typing the first dollar sign ($), a popup will appear allowing you to choose and insert one.
Also enter a Default Caption and Default Unique Name on the left, and then click apply to save your formula. It will now be listed as one of the data cube elements.
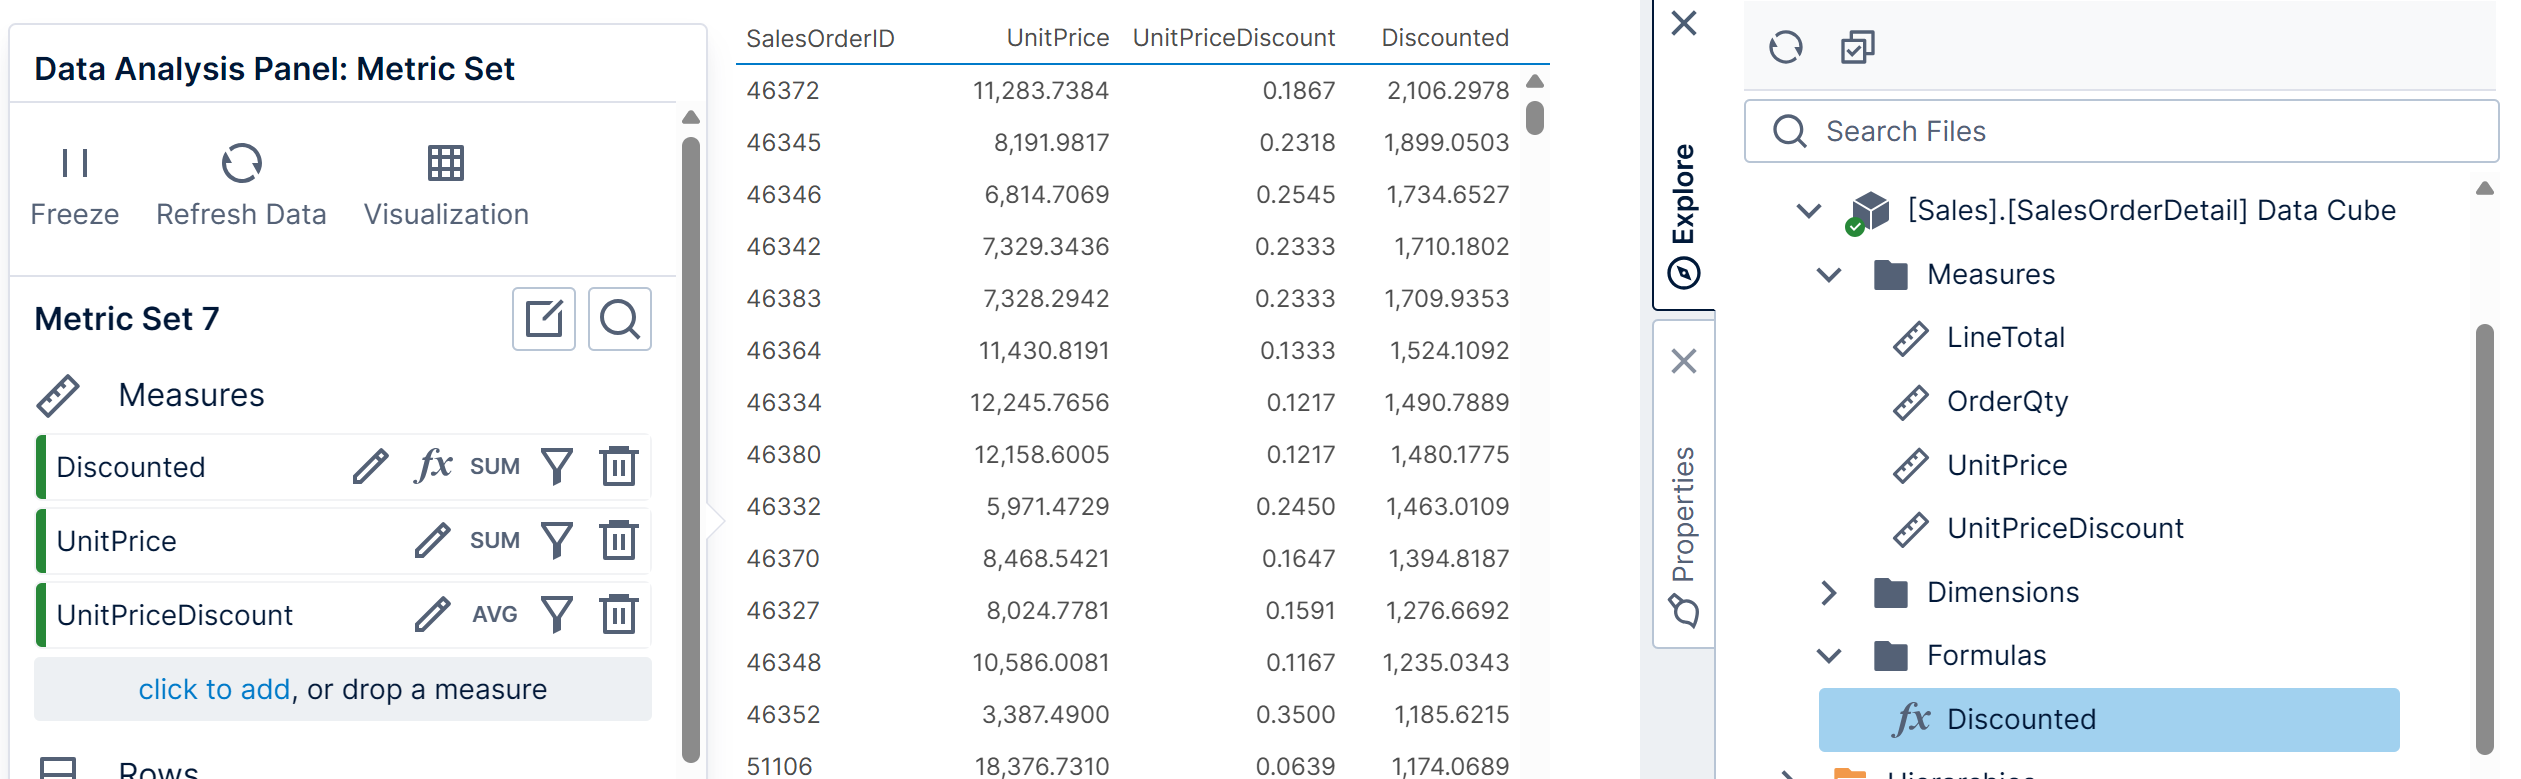
The formula can be used in a metric set. If you are editing a view such as a dashboard, open the metric set's Data Analysis Panel for a visualization (the metric set must be checked out to you).
In the Explore window, expand the Data Cubes folder and your data cube, then expand its Formulas folder and drag the formula to the Measures section of the Data Analysis Panel.
From this point on, the formula in this metric set is separate and is not affected by changes to the original formula in the data cube.
Any elements referred to in the formula are required and will be added to the metric set automatically at the same time. If needed, the formula can now be edited for this metric set like any other formula.
2. Configure
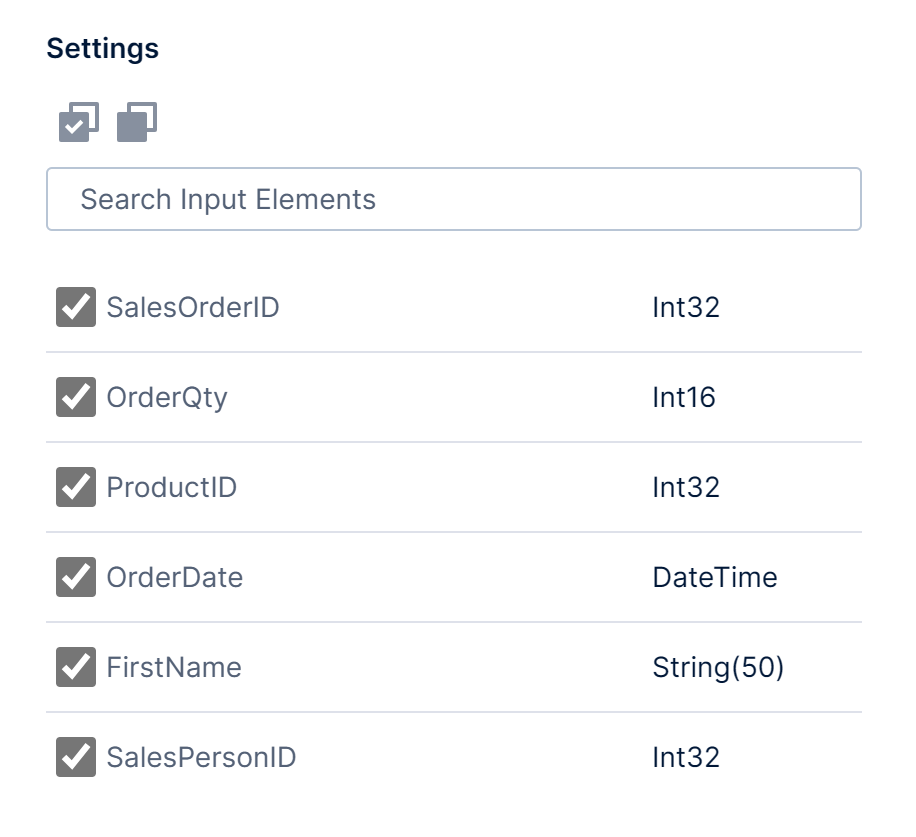
Double-click the Process Result transform to see its configuration dialog, or select Configure from the toolbar or context menu.
Uncheck any columns which you don't need to be part of the data cube output. This will completely remove the column from the data cube and will make the column unavailable for subsequent linking in hierarchy keys (e.g., if you need to use the data cube to build a hierarchy).
To improve performance, de-select data you don't need from another transform as far to the left as possible instead.
3. Output
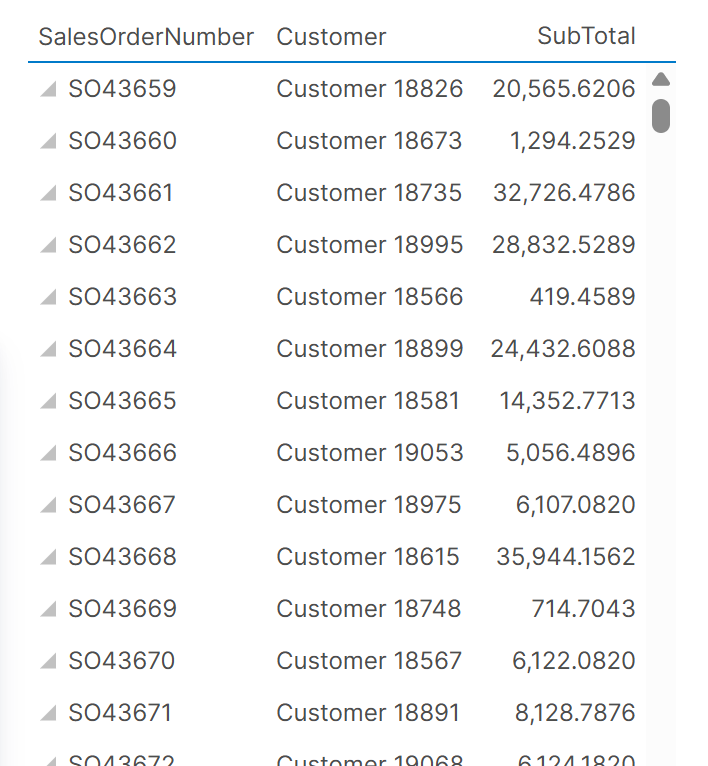
Select the Process Result transform on the canvas and then open the Data Preview window to see a preview of the data output generated by this data cube.
This output data is not transformed into measures or hierarchies until used in a metric set, so most changes made from the Data Cube Elements panel are not reflected in this preview.