
1. Overview
You can apply formulas to data by writing small expressions like in a spreadsheet program. A formula expression can be a simple constant value, arithmetic or other math functions, a call to a built-in formula function such as AVG or TOP, or any combination of these. For more complex formulas, you can write DundasScript and call other methods.
This article contains examples showing the use of formulas while editing a dashboard or another view, but this process is almost identical when editing a full screen metric set.
Related video: Formulas
2. Accessing the formula bar
With your visualization selected on the canvas, click Data Tools in the toolbar and then Formula.
Or, when editing a full screen metric set, simply click Formula in the toolbar.
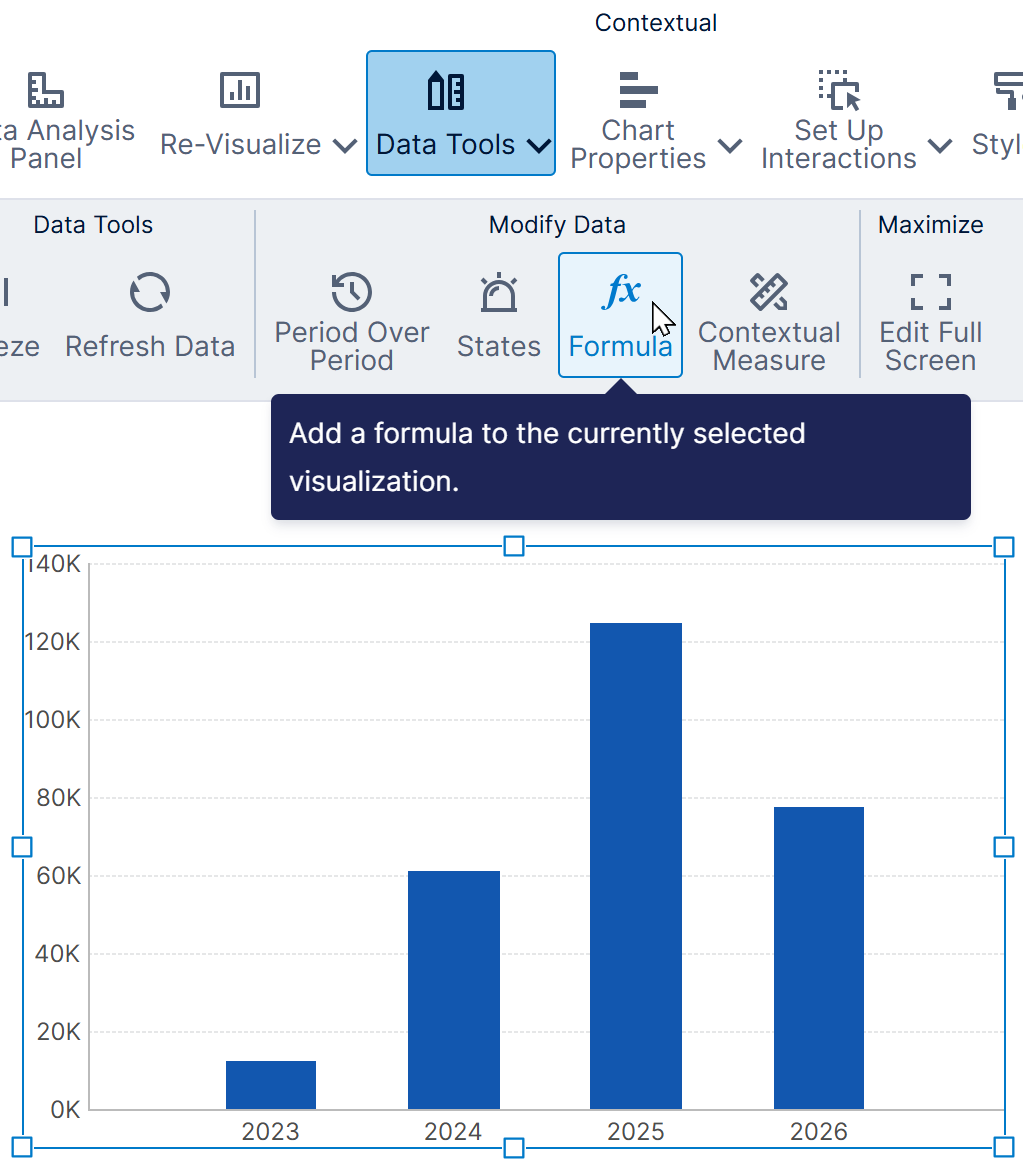
A formula bar appears below the main toolbar.
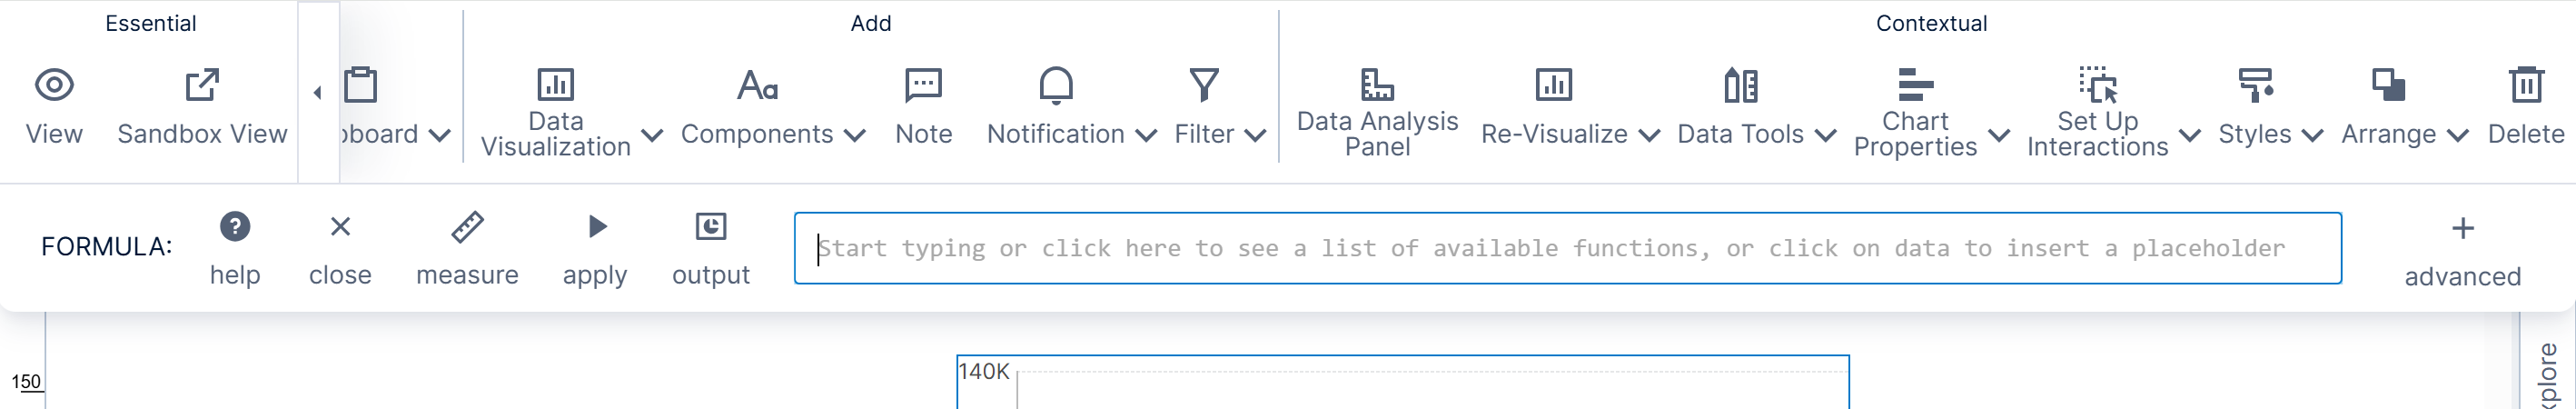
Type your expression into the formula bar, and then in many cases you can simply click apply or press Enter to add your formula. Different sections of this article below describe the different kinds of formulas you can enter.
There are some options available before you click apply:
- In version 26.1.2 and higher, there is a toggle button for switching between a formula measure and a formula hierarchy if you used the steps above. Most formula results are numeric and should be a measure, but you can choose a hierarchy if the formula returns text or date values, for example. See the hierarchy section for more details.
- If your visualization is a chart, there is an output button for formula measures you can click to choose what chart type to use for the new formula. This is demonstrated in the constant value example in the next section.
- There is also an advanced mode for entering more complex, multi-line formula expressions. See the advanced mode section for details.
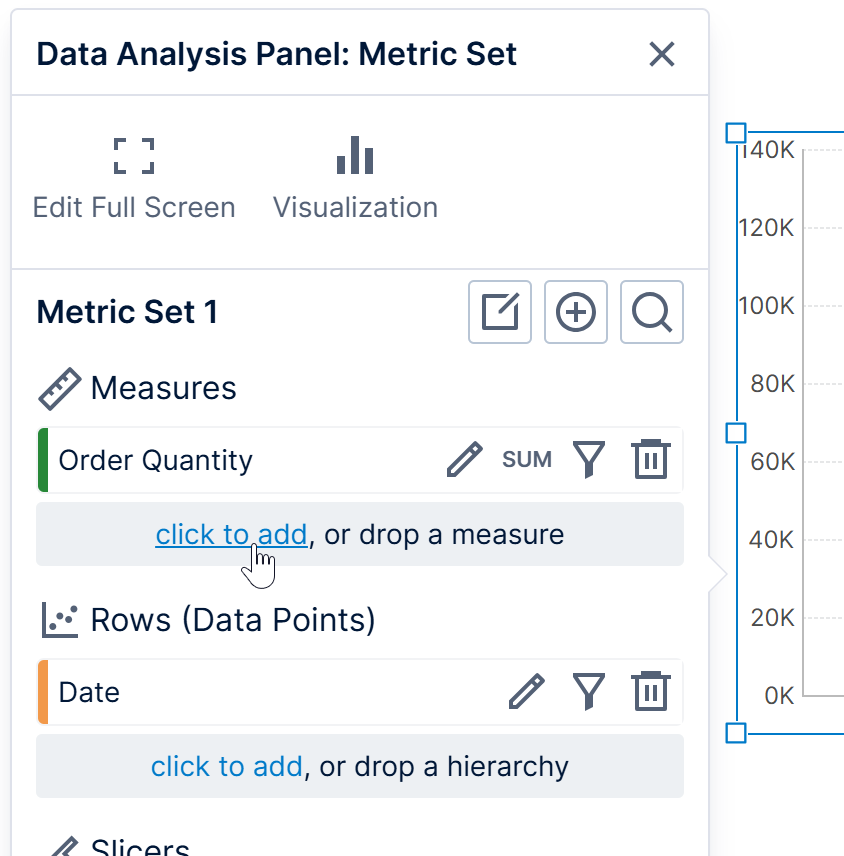
An alternative way of opening the formula bar is from the Data Analysis Panel: click to add under Measures for a numeric formula result, or under Rows or Columns to add a formula hierarchy in version 26.1.2 or higher.
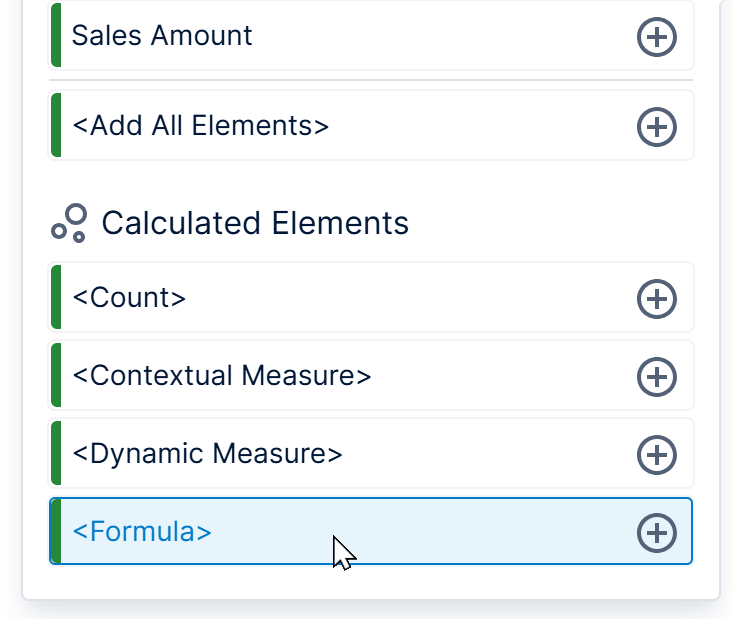
Then click <Formula> at the bottom under Calculated Elements.
3. Simple formulas
By default, the formula bar starts off in a simple editing mode that allows you to enter a one-line expression.
3.1. Constant value
The simplest formula expression you can have is a constant number value.
As an example, we will add a formula measure to a bar chart and click the optional output button on the formula bar.
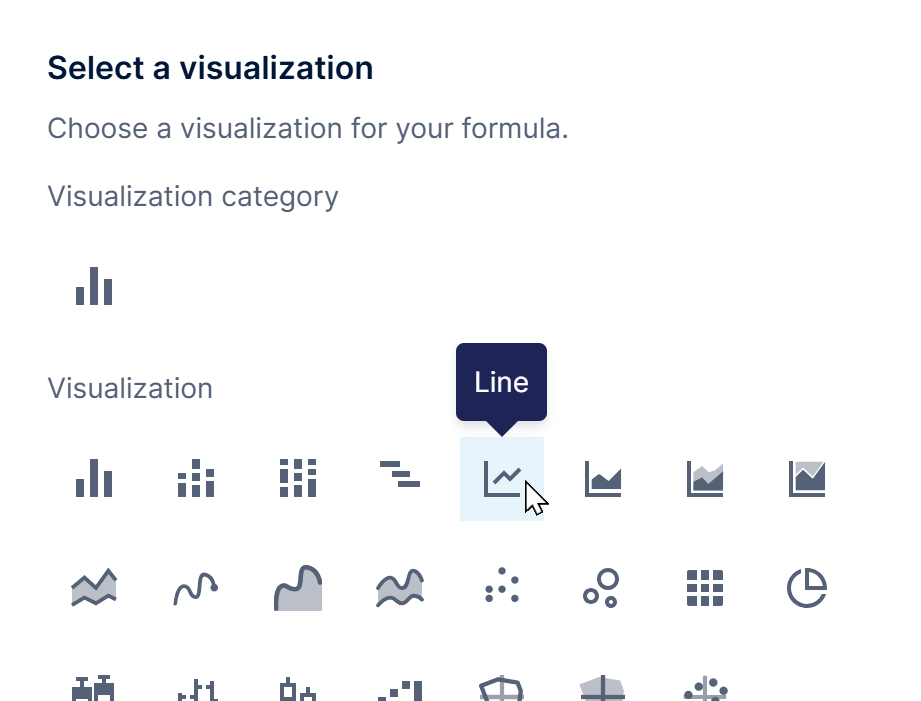
In the dialog that appears, we can select Line to add the formula as a line across the bar chart rather than as another series of bars, then click Save. (You can also re-visualize it later.)
Type a number into the formula bar and click apply or press Enter.
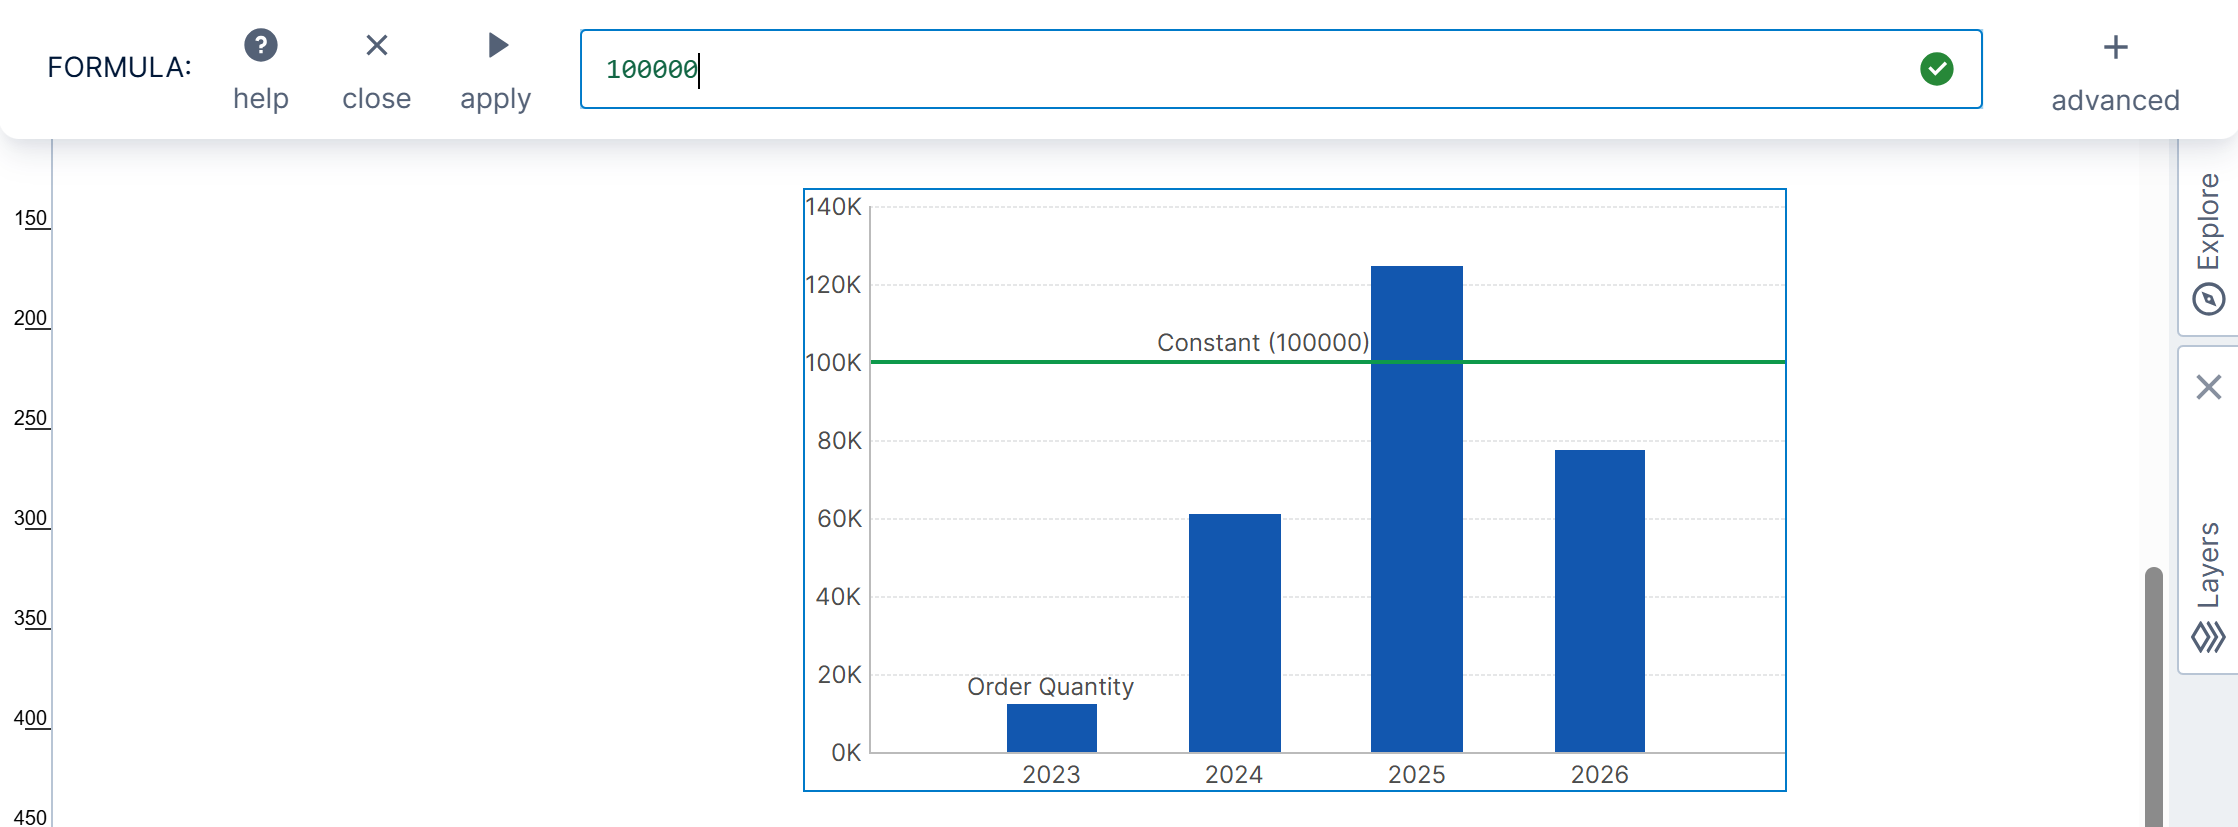
A checkmark appears on the right confirming the formula syntax is correct, and the formula is added as a line series.
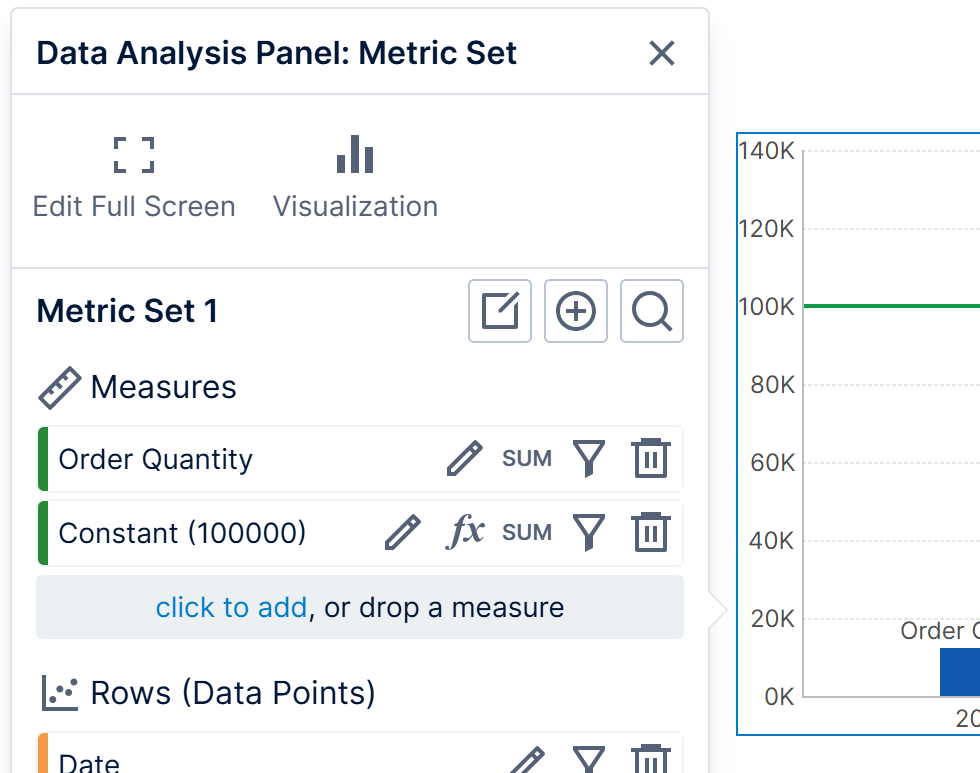
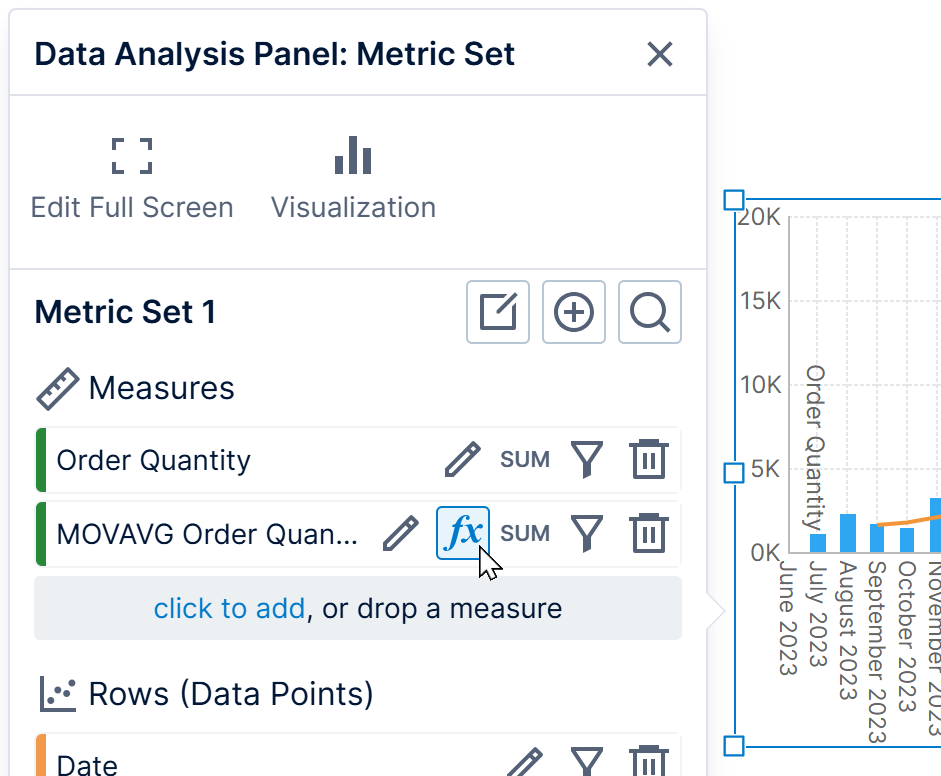
Open the Data Analysis Panel to see the formula added as a second measure to the metric set, appearing with an fx icon.
3.2. Placeholders
A formula expression can include placeholders representing the other data in your metric set.
To insert a placeholder, type a dollar sign ($) character in the formula bar. You will see a menu that lists available placeholders you can click or use the keyboard to select and insert.
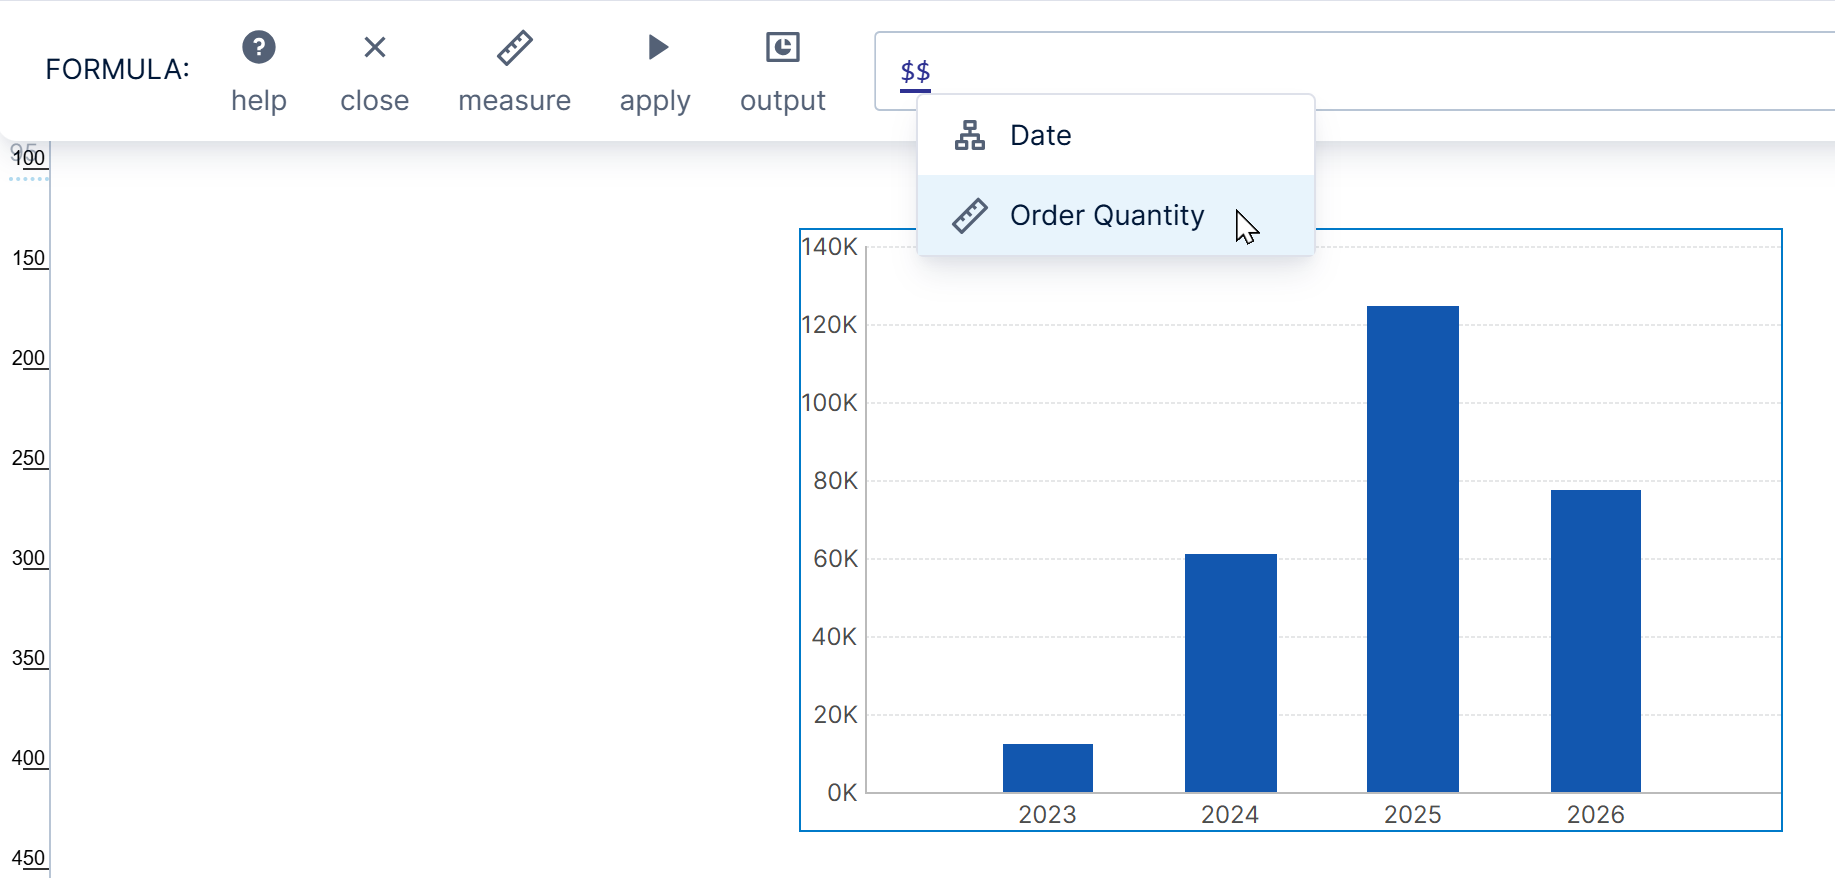
The inserted placeholder consists of the measure or hierarchy name enclosed between dollar sign characters (e.g., $Order Quantity$).
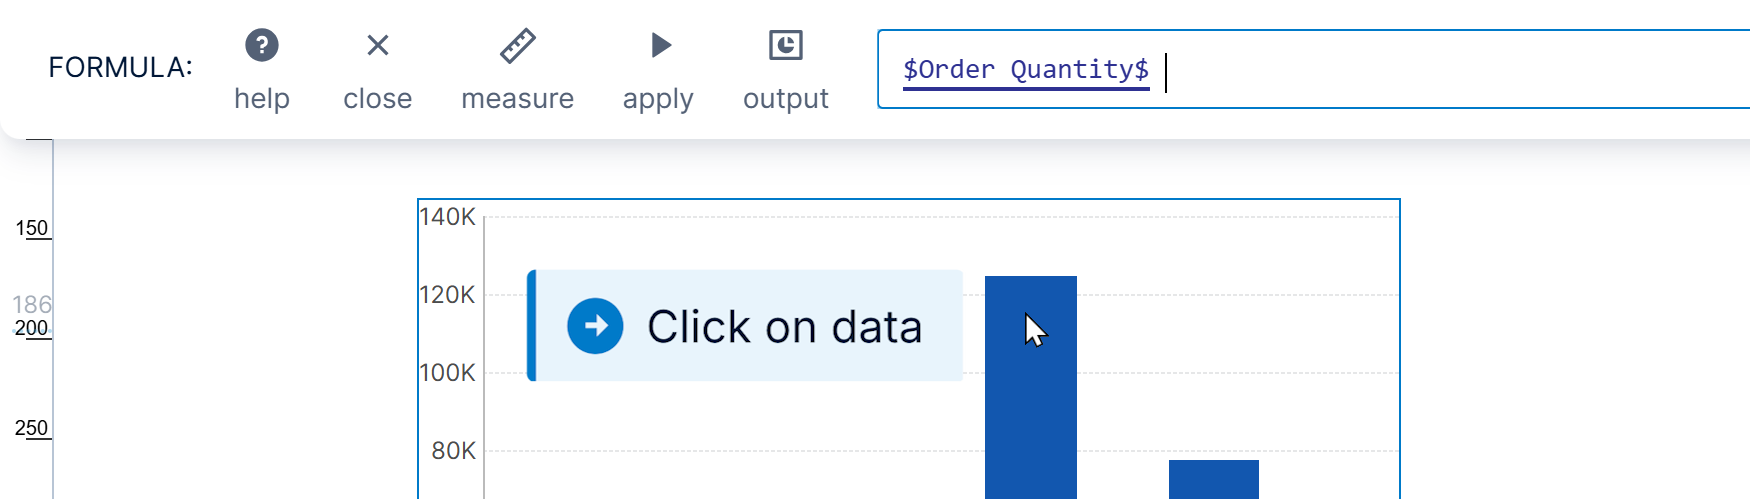
Another way to insert a placeholder is to click directly on data you want to insert from your visualization. For example, click a column in a table, or a data point or axis label in a chart.
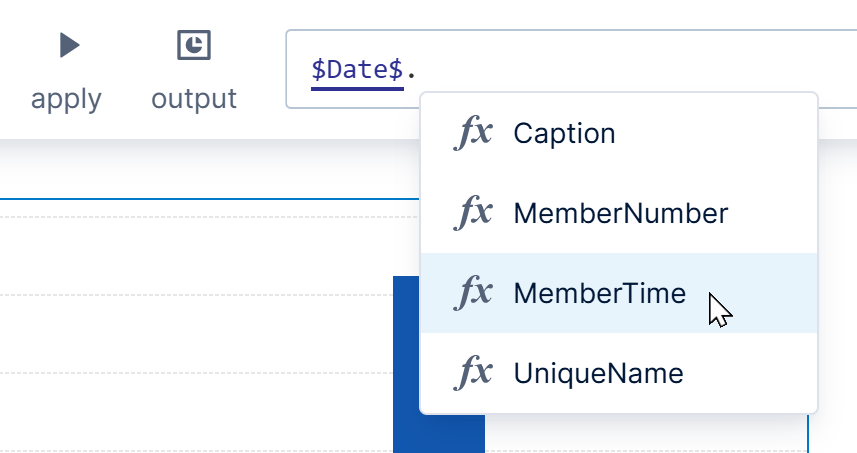
If you are working directly with hierarchy values in a formula, you can type a period (.) and one of the following API properties of a hierarchy member: MemberTime, MemberNumber, UniqueName, or Caption, or choose one of these from the popup that appears.
If no property is specified, Caption may be used by default, but you should specify a property before accessing another property or method afterward with another period.
If your formula is a measure, you can refer to hierarchy values but should return numeric values. Some examples are provided below.
For a hierarchy containing numeric values, you can access the underlying number:
$ProductID$.MemberNumber
With a time dimension or hierarchy, you can subtract one underlying DateTime value from the other to calculate a TimeSpan and access its TotalDays property:
($EndDate$.MemberTime - $StartDate$.MemberTime).TotalDays
You can return numeric values that test your text values for some condition:
if ($Hierarchy$.Caption == "Test") return 1
3.2.1. Placeholder settings
For some additional options, after adding a measure placeholder to your formula, click it to open the Placeholder dialog. (When first adding the placeholder, click apply first.)
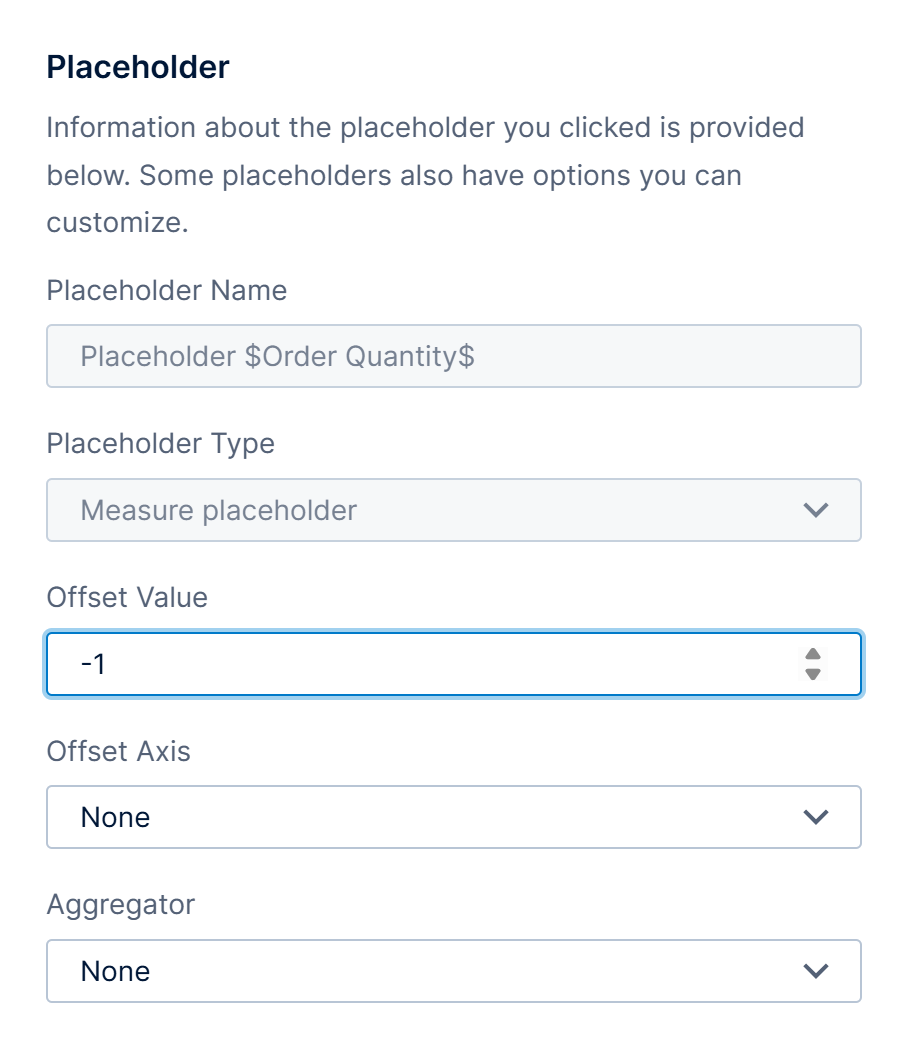
To refer to values from other rows or columns, set Offset Value and Offset Axis. For example, an offset of -1 Rows can refer to the previous row's value.
The Aggregator can optionally be set to get the overall aggregated sum, average, etc., just for the values inserted by this placeholder into the formula.
3.3. Math
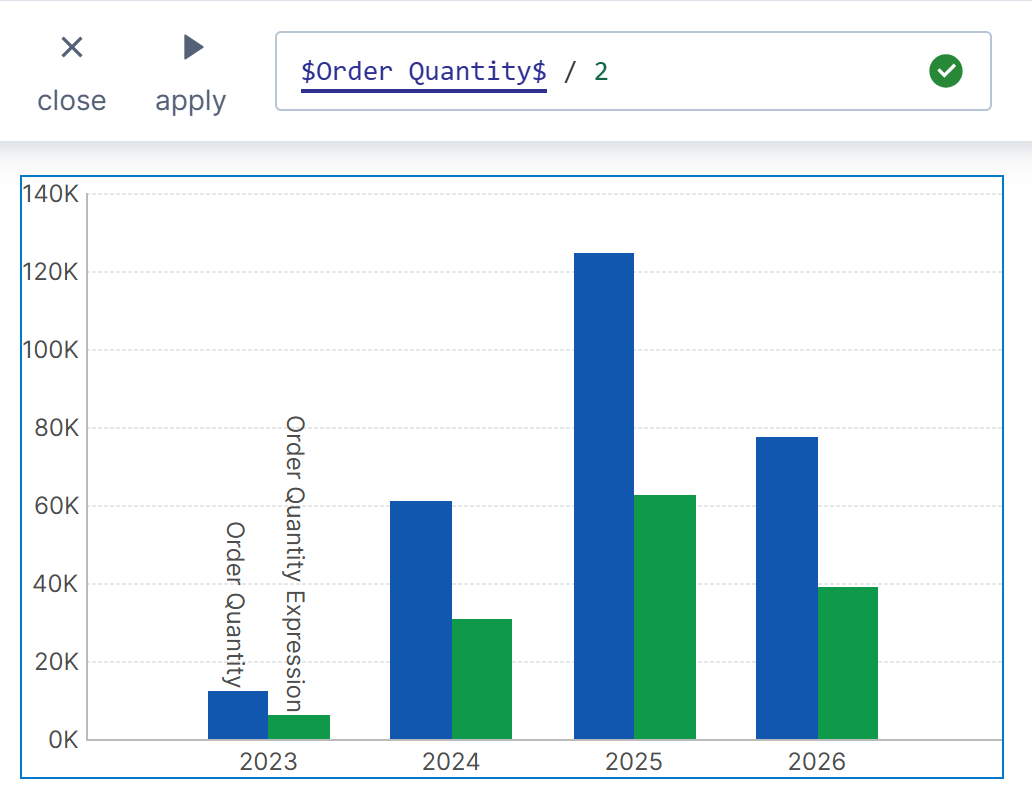
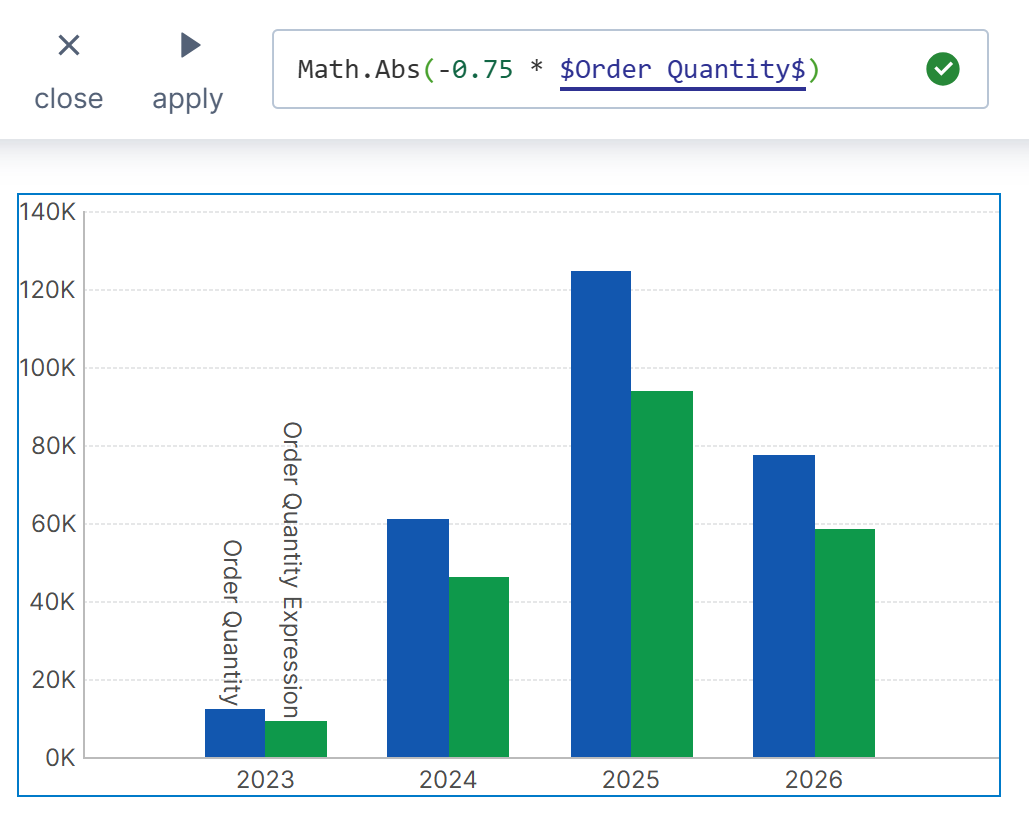
You can use arithmetic operators within a formula expression as well as math functions such as Math.Max() and Math.Abs(). These arithmetic operations and math functions are calculated separately in each row.
Examples:
- $Order Quantity$ / 2
- Math.Abs(-0.75 * $Order Quantity$)
3.4. Functions
When adding a formula measure, there are over 50 built-in formula functions that you can apply to your data. These functions work with the entire series of values you specify when calculating their result.
Type a letter in the formula bar and you'll see an auto-complete menu showing a list of matching functions you can choose from.
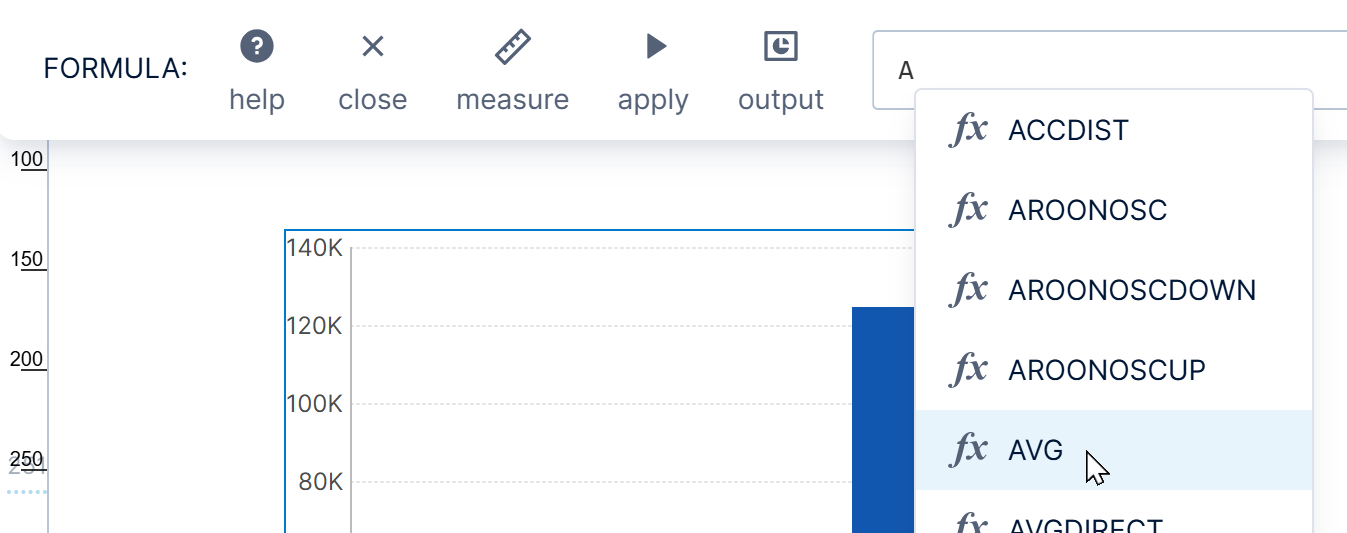
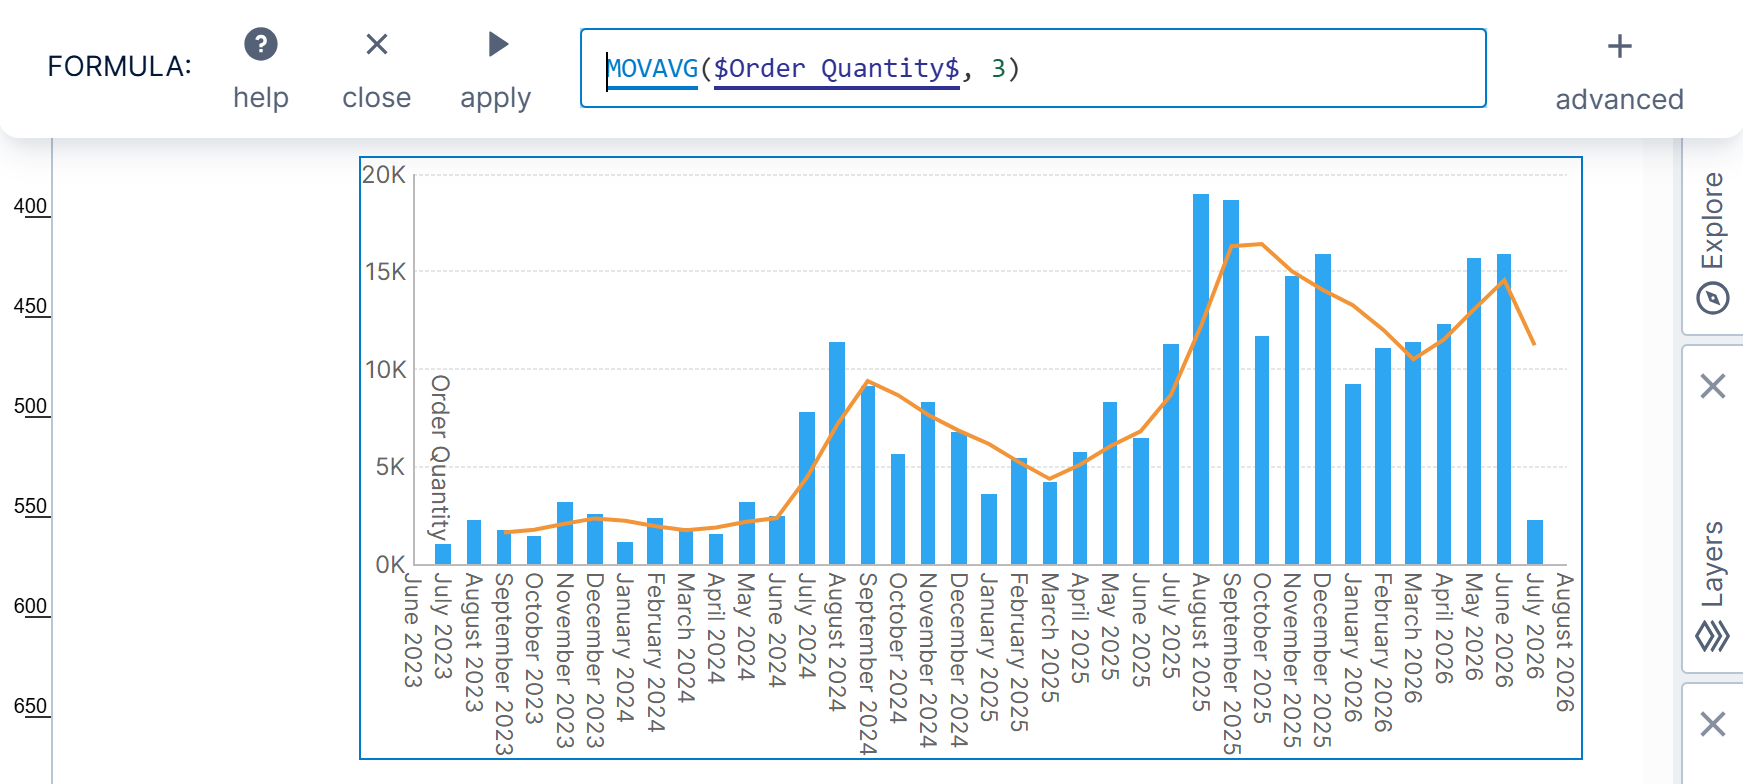
Once you've chosen a function (or typed it in manually along with the open parenthesis), a tooltip appears showing the required and optional arguments for the function.
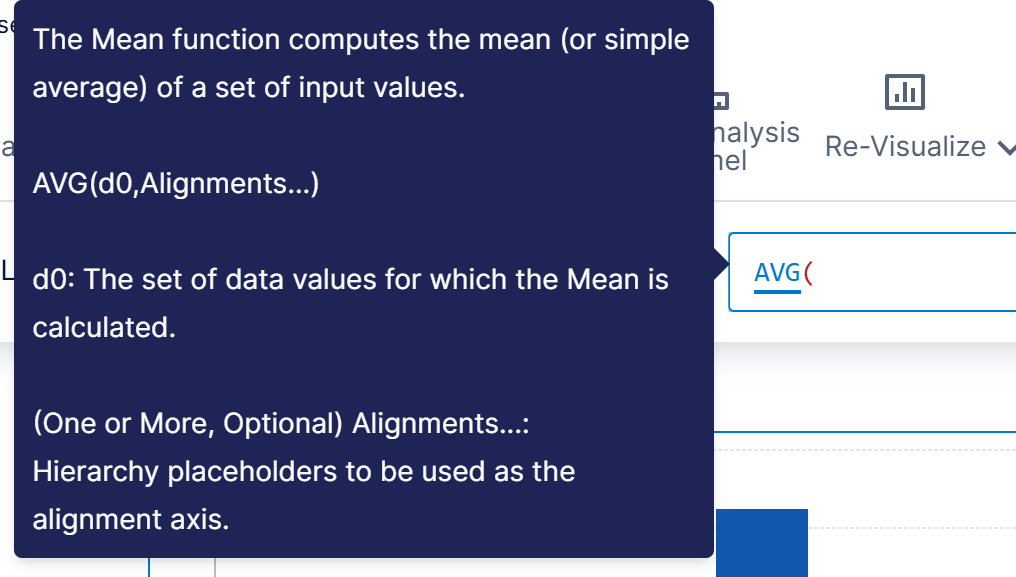
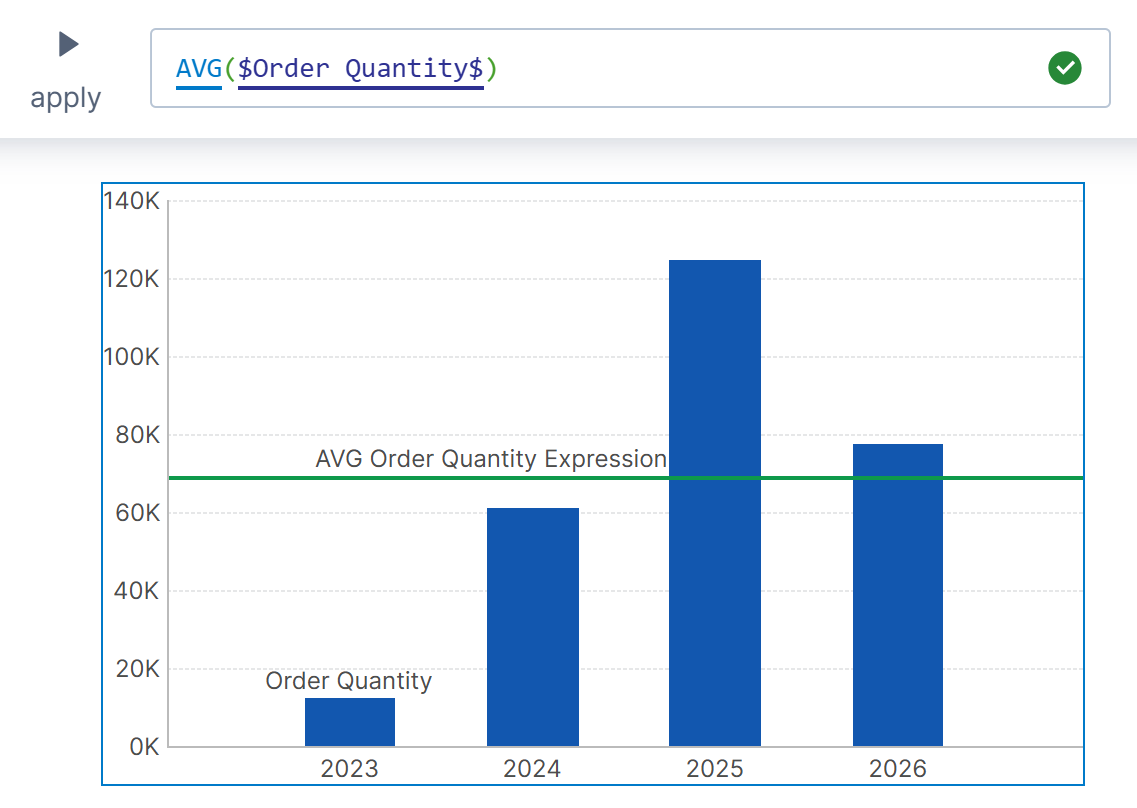
Most functions take in numeric values (measures) as inputs. The first argument for the AVG function is a measure placeholder, which you can insert by typing a dollar sign character or clicking on a data point.
4. Advanced mode
Click the advanced button on the right of the formula bar to go into advanced editing mode. This button works like a toggle, allowing you to flip between simple and advanced modes.
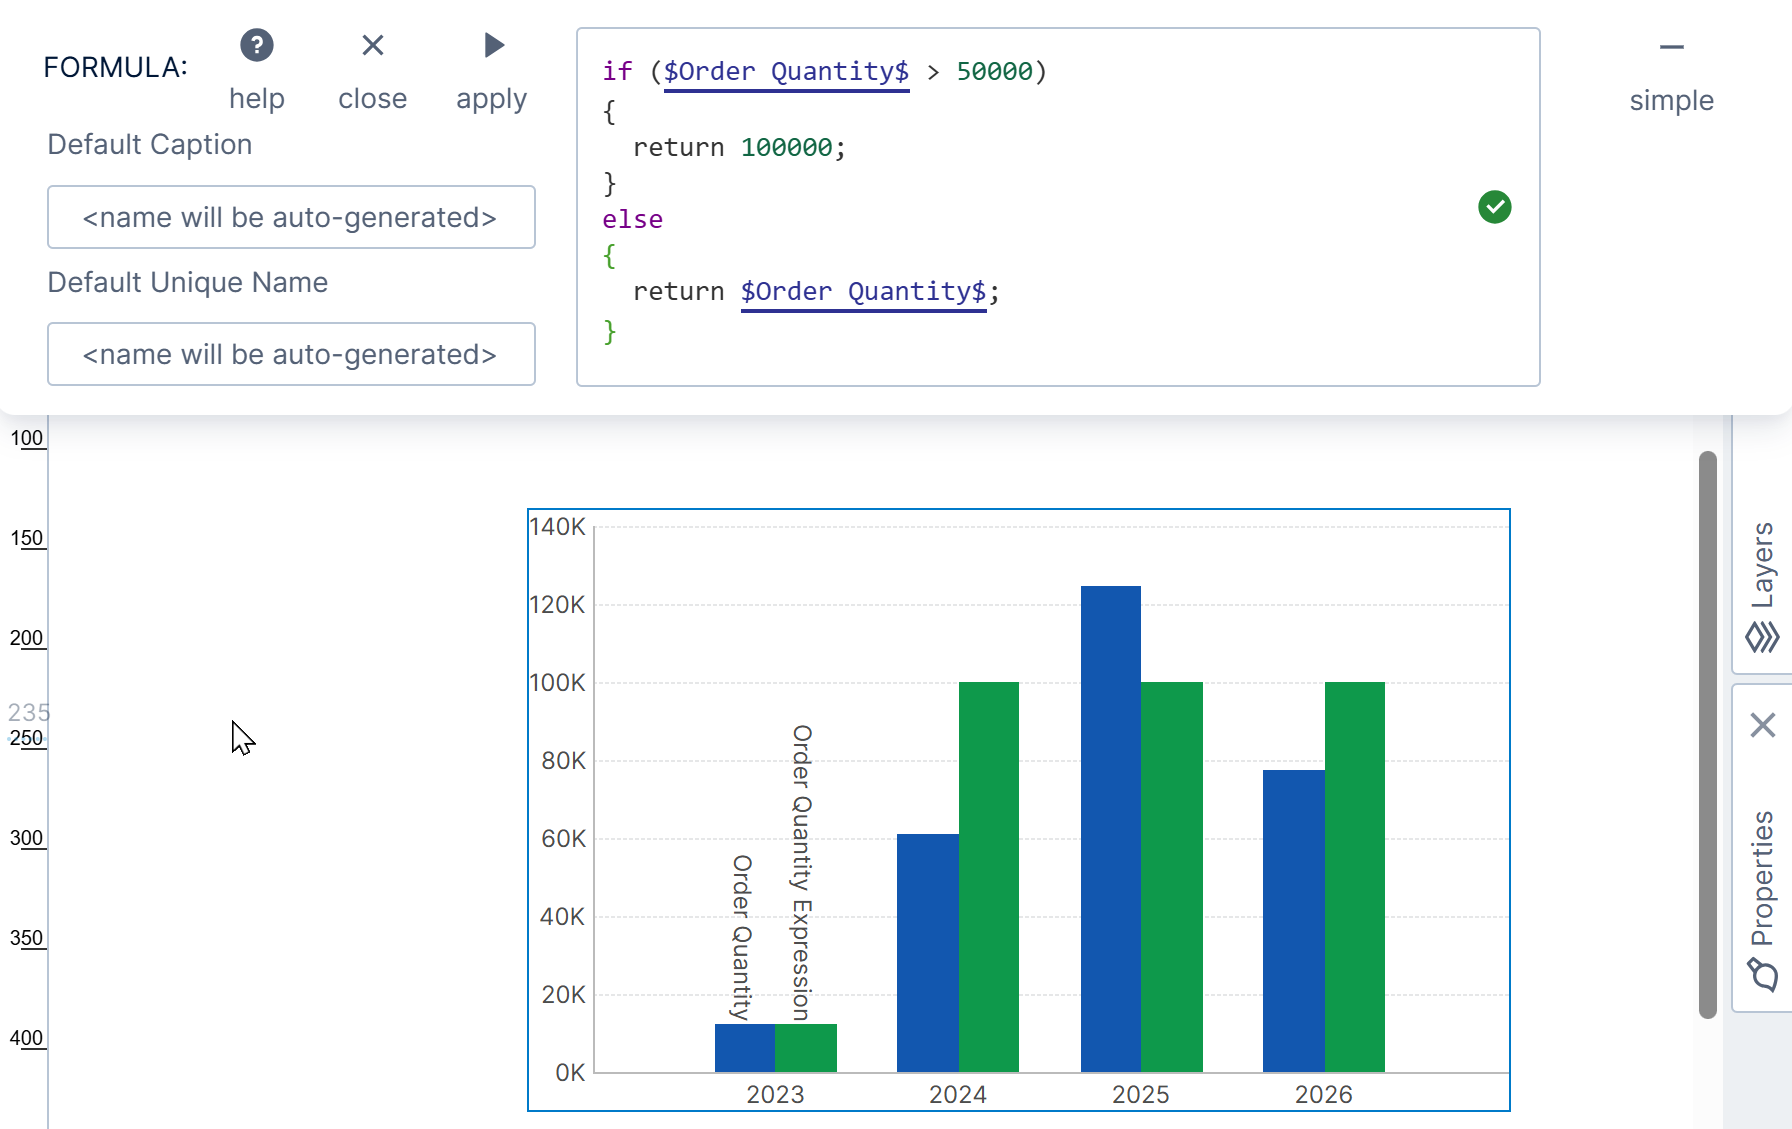
In advanced mode, you can enter multiple lines of script to more easily write more complex if-else logic and other DundasScript syntax. There should always be at least one return statement in advanced mode.
For example, a constant formula must be entered as:
return 40000
if ($Measure$ > 100) return 1; else if ($Measure$ < 0) return -1; else return 0;
Another reason to use advanced mode is that you can enter your own Default Caption and Default Unique Name rather than allowing them to be generated for you when the formula is created.
Alternatively, you can change them afterward by clicking to edit the overall settings for the formula in the Data Analysis Panel and finding Caption and Unique Name.
5. Formula hierarchies
In version 26.1.2 and higher, you can add a formula as a hierarchy, which can have non-numeric values as a result, such as string (text) or date/time values.
When adding a formula, click the measure button to switch to a hierarchy, or click to add under Rows or Columns in the Data Analysis Panel.
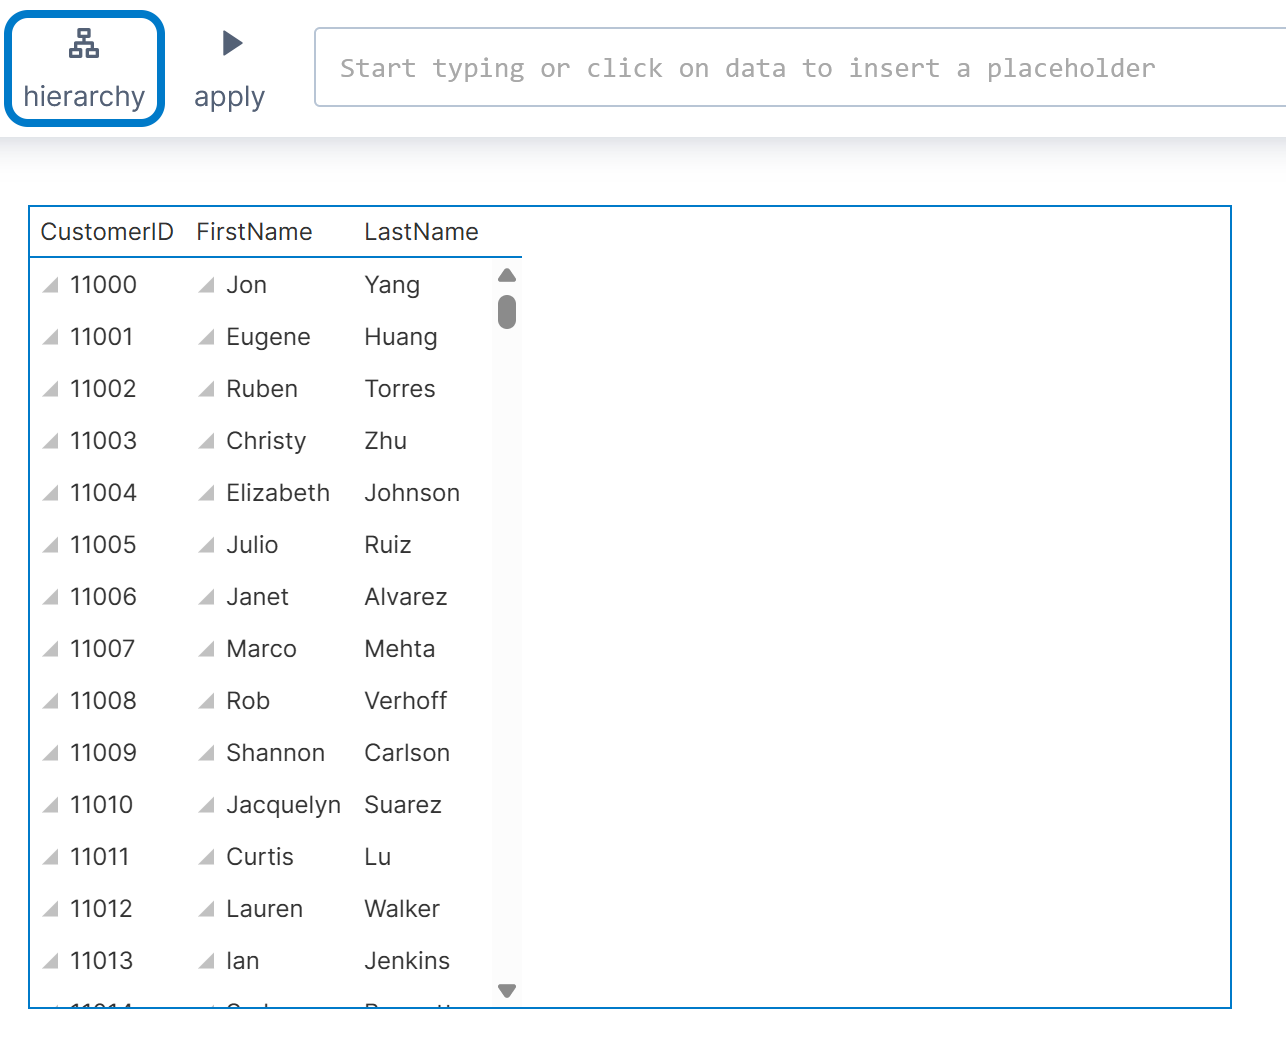
You can use all of the same features as a formula measure, except for formula functions. Available options include DundasScript syntax such as the + operator, which can be used to combine string (text) values together just like in various other scripting languages:
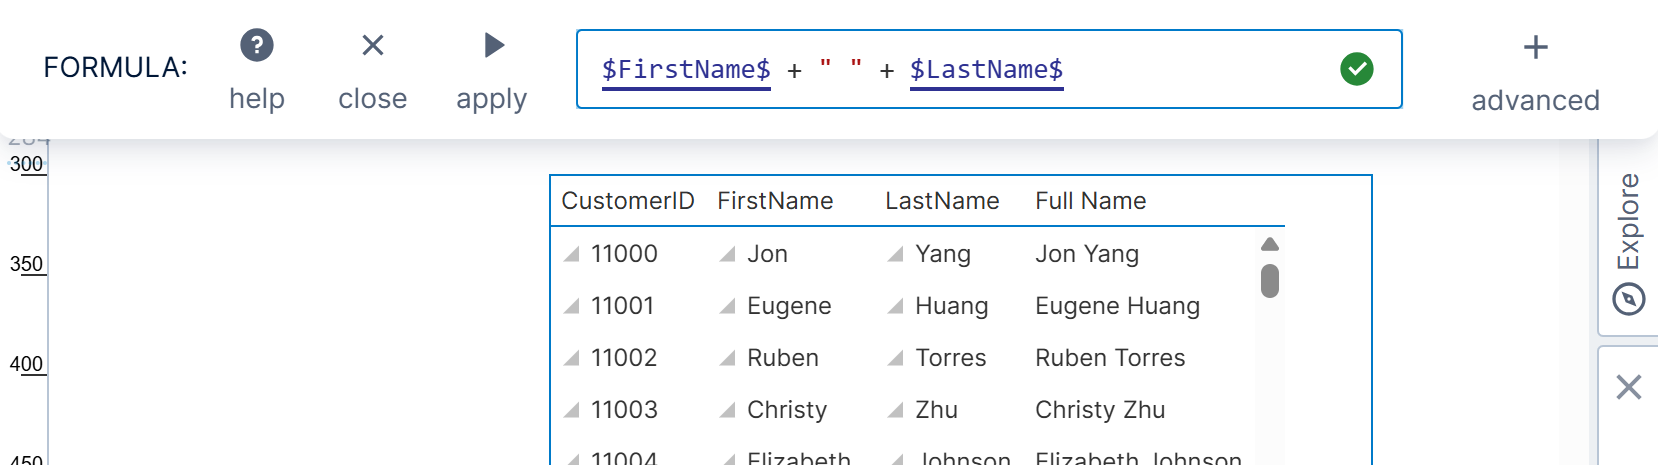
Check the .NET methods available for string (text) and DateTime when working with those types of values, as well as other classes available with DundasScript that may work with them.
When accessing methods or properties on a hierarchy placeholder, remember to add a period (.) and specify one of its properties such as Caption or MemberTime first. For example:
$Full Name$.Caption.Split(' ')[0]
You can move your formula hierarchy between Rows and Columns in the Data Analysis Panel, but Slicers is not supported. See also the notes section for some limitations.
6. Formula visualizations
When editing a dashboard or another view, click Data Visualization, and then click Formula Visualization under the Formula category.
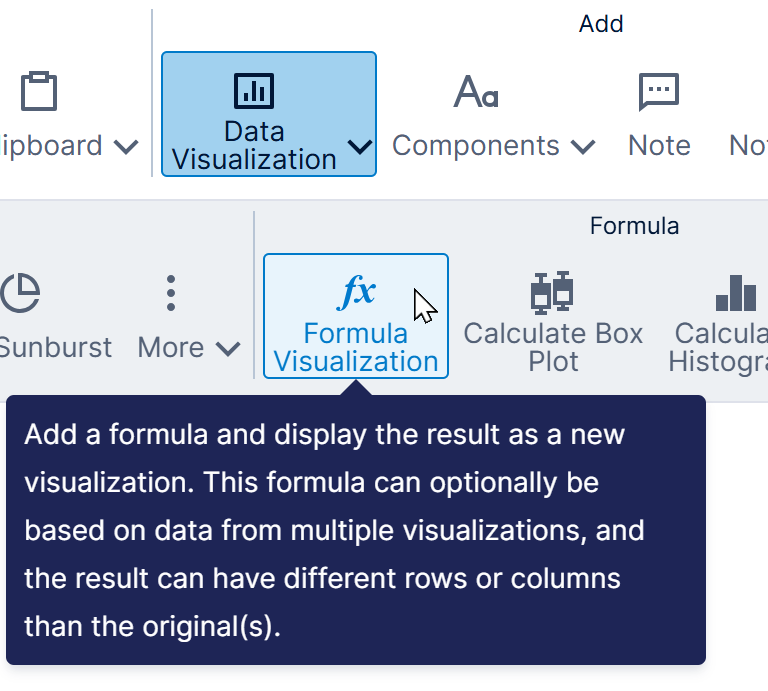
This opens the formula bar just like when adding a regular formula, except that you are able to optionally refer to data from multiple visualizations or metric sets rather than just one.
When you click apply, an entirely new metric set is created and displayed in a new visualization instead of modifying an existing visualization and metric set. This new metric set is called a formula metric set, and it is able to produce an entirely different output than the metric set(s) it was based on, potentially consisting of different rows, columns, and measure values.
For a walkthrough on adding formula visualizations, see Using a formula visualization.
7. Editing a formula
After adding a formula, you can always go back and edit it by clicking the fx button in the Data Analysis Panel.
The formula bar opens with the formula expression you last entered.
You can make changes to the formula and then click apply.
8. Parameter placeholders
In addition to placeholders for measures and hierarchies, formulas support parameter placeholders, which allow you to refer to the value of a parameter. This can allow viewers of dashboards and other views to enter their own value into the formula using a connected filter, pass in a value through an interaction, or for custom functionality implemented in script to affect the formula when viewing.
To create a parameter placeholder, simply type one in when adding or editing any formula. Choose a name that's not already taken by an element in your metric set, and surround it with dollar signs ($). (After typing a dollar sign, a popup menu will list the names that are already taken.)
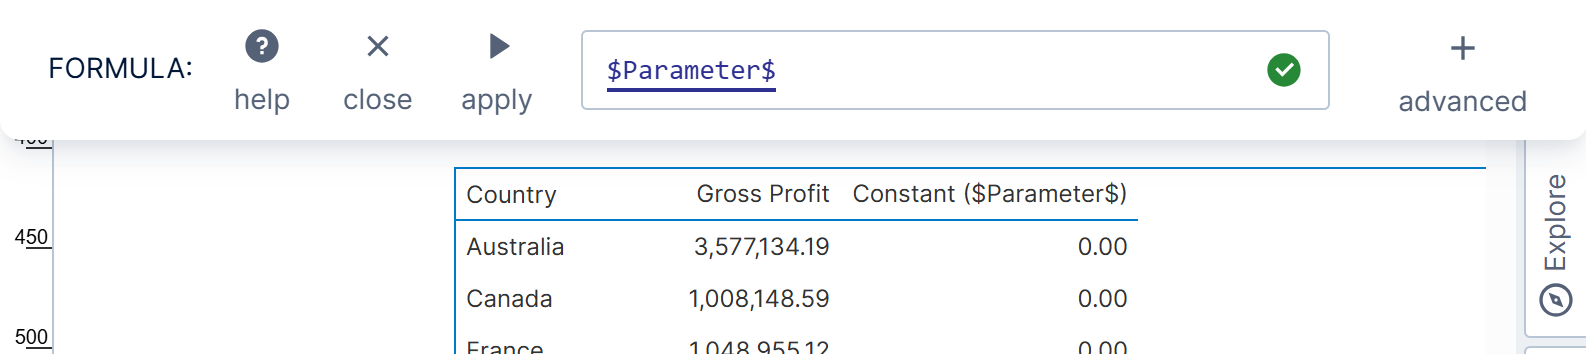
This placeholder can be entered by itself, or inserted anywhere in the formula you would like to be able to change the value later. Click apply when done.
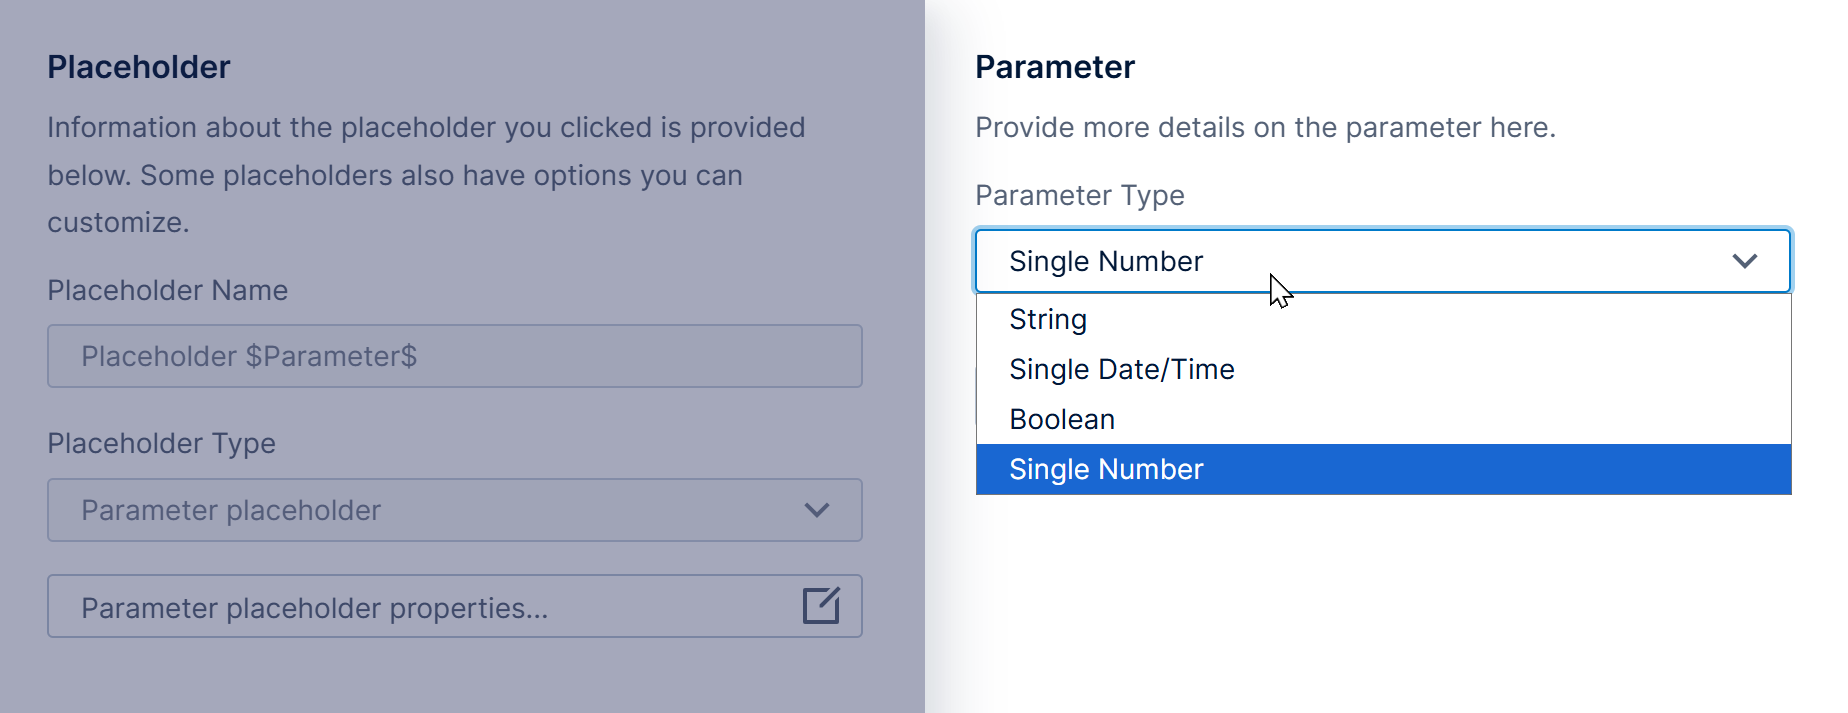
This creates a parameter that is numeric. If you want a different type, click on the placeholder to open the Placeholder dialog, then click Parameter placeholder properties... to find its options.
Now you can go to Filters in the toolbar and add a filter such as Single Number or Slider if the parameter is numeric. To set the parameter value through an interaction or through script instead, open the Parameters window and add a new view parameter.
In the connections list that appears, un-check any existing connections for regular filter parameters, then find and expand your formula measure. Connect to its Single Number parameter (or the Single value of whichever parameter value type you chose if you changed it).
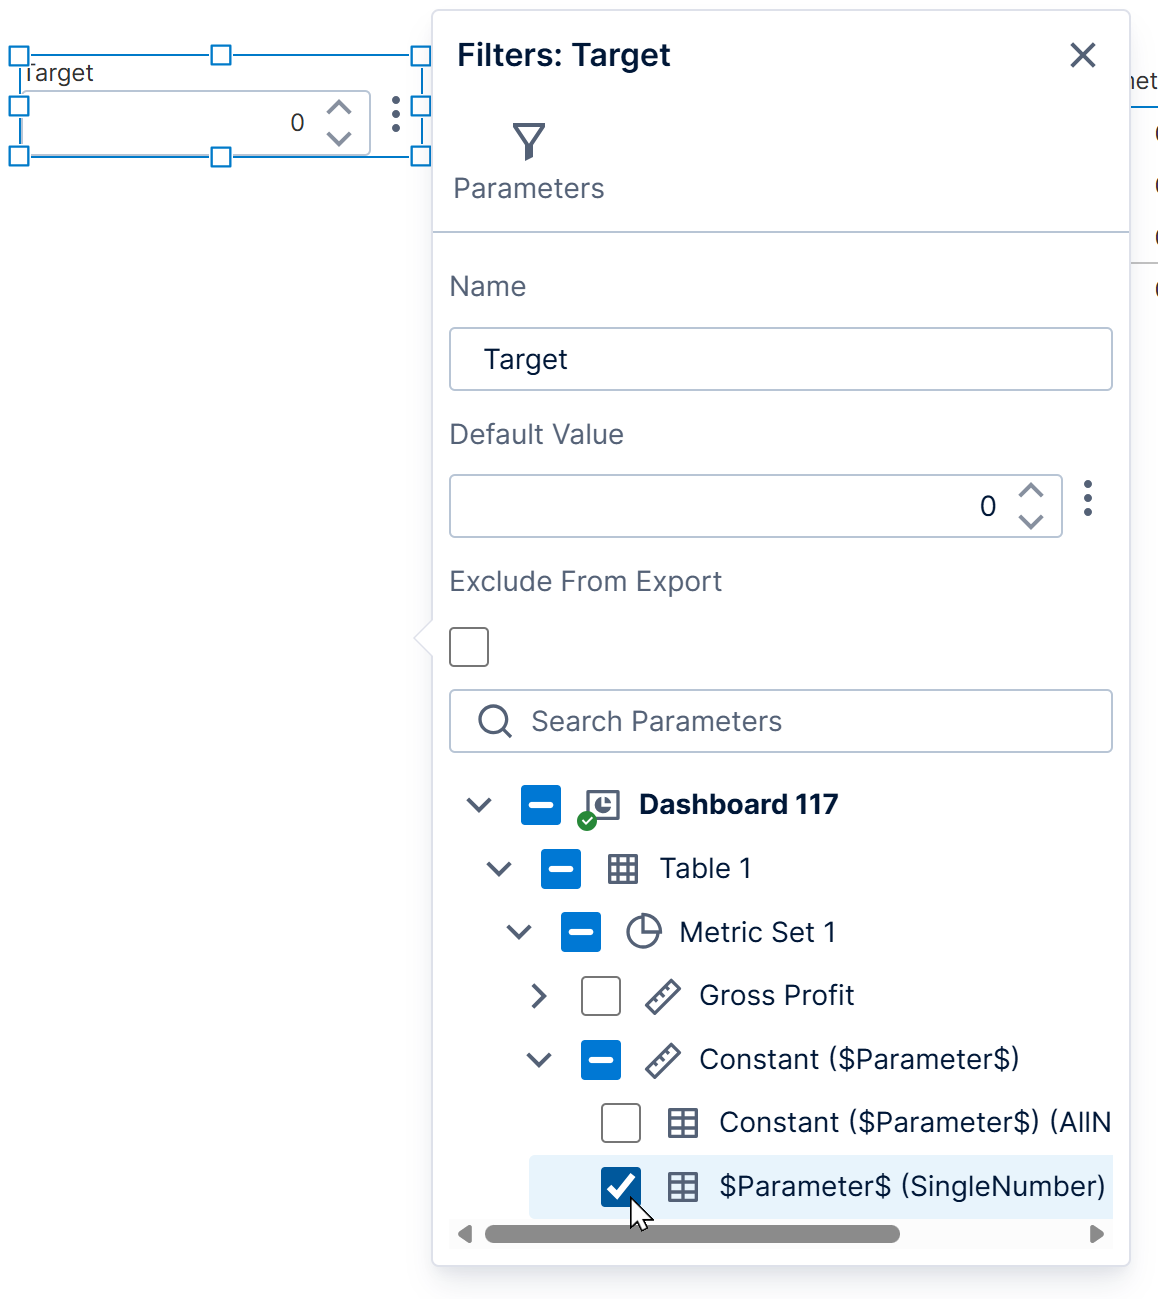
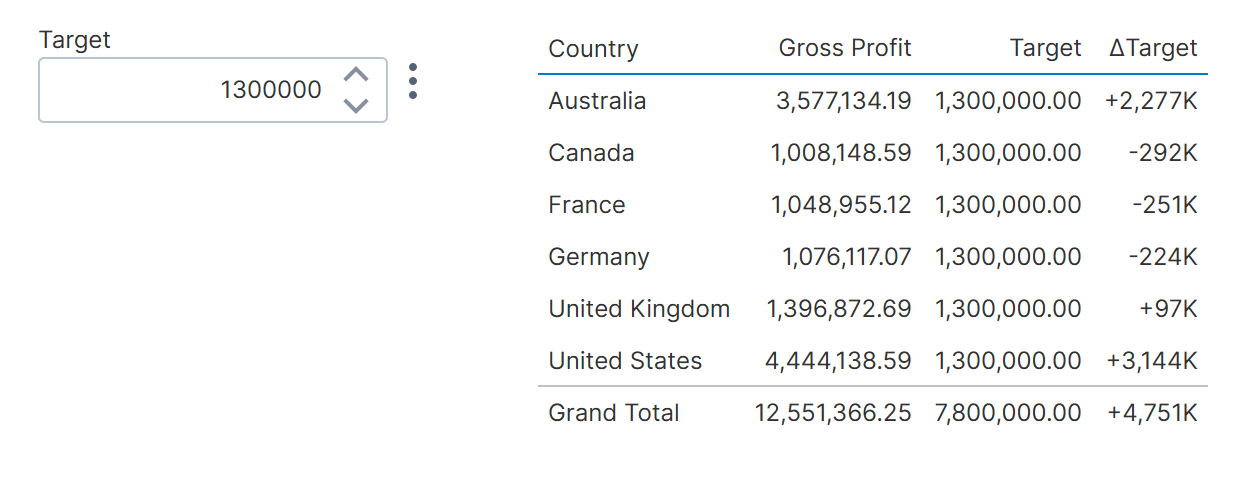
With a filter, anyone can now change the value used in this formula when viewing.
9. Filtering
When a metric set contains formula measures, filtering happens in two passes: once before formulas are calculated, and then again on the formula results:
- The metric set's data is filtered by hierarchy values and by measures that are not formulas
- Formula functions run their calculations based on this data
- The resulting data is then filtered by formula measure values
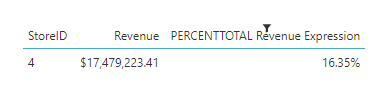
For example, the following table shows a formula measure using the Percent of Total function, which was calculated based on the entire set of rows. Filtering this formula measure to a range of 0.15 (15%) and up preserves and filters by these calculations, displaying only one row:
10. Notes
- At this time, formula hierarchies cannot be used with data cubes using in-memory storage or with formula visualizations/formula metric sets.
- When formulas are calculated for the members of a time dimension hierarchy at the Week level, and the results are visualized in a chart set to use a Date/Time scale, the Week 53 member of one year and Week 1 member of the following year often must be combined together into a single member representing the full seven days. In this case, the aggregator set on the formula measure is used to combine the two formula results together in most cases such as for aggregators Sum, Average, Minimum, Maximum, and Count. For other aggregators, one of the two week's values may be displayed.