
1. Overview
This article shows you how to format how data is displayed as text in visualizations or their tooltips:
- Metric sets determine how to format numbers (measures) and unknown members, for example the number of decimal places.
- Time dimensions have customizable formatting for each time period/level.
- Visualizations can combine multiple values together with predefined text and can also change number and date/time formats.
Related video: Using The Data Analysis Panel
2. Metric set element format
You can format a measure displaying numeric data by changing the metric set while it's checked out to you.
In the Data Analysis Panel, click the green tile for your measure to edit its settings, then click Define text formatting at the bottom.
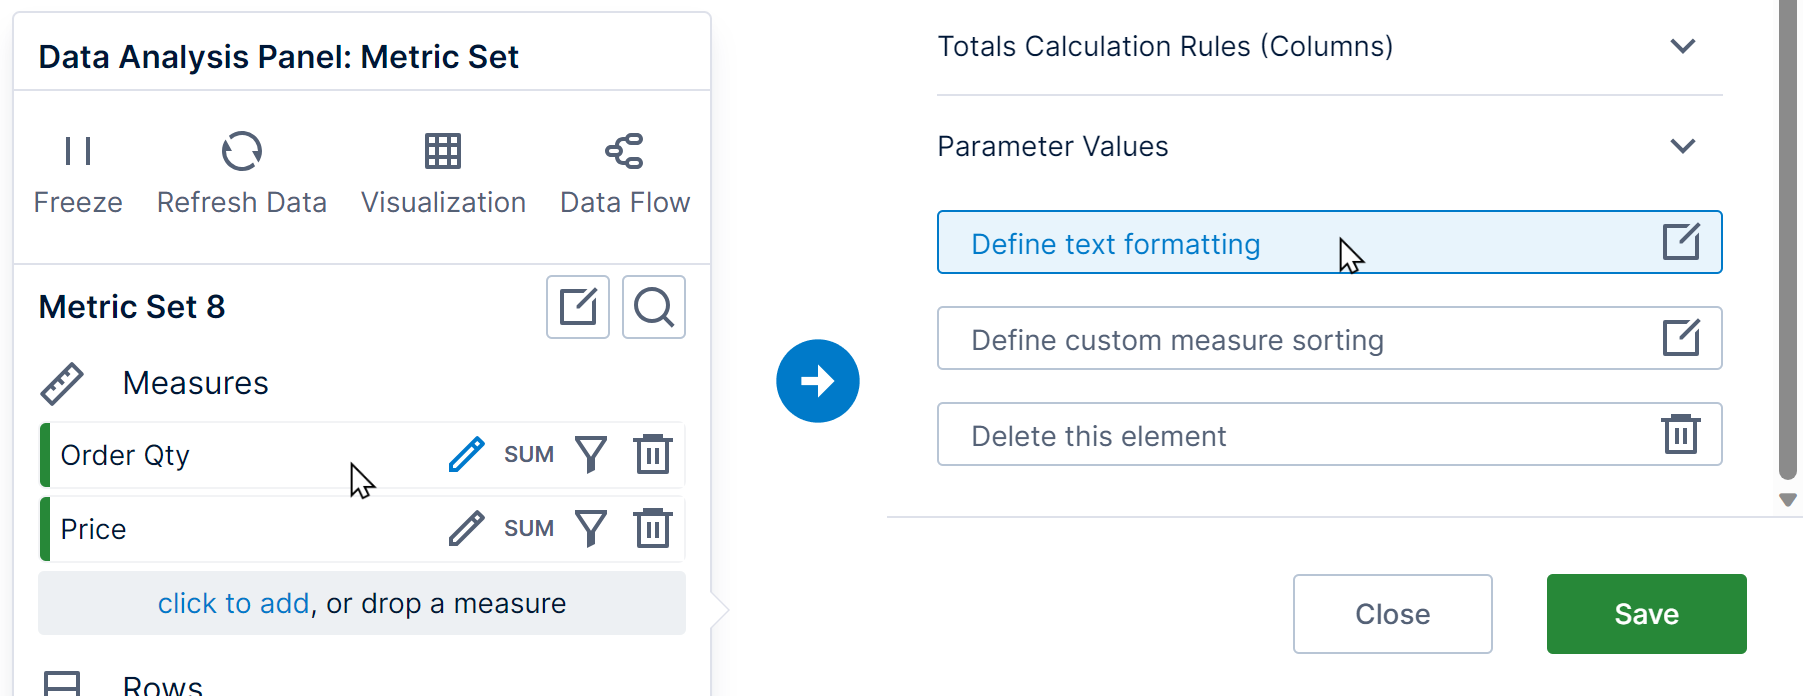
This opens the Configure Formats dialog, containing multiple formatting options.
To set up the main formatting, click to Set format. If previously set, this button may display the measure's current format as its text (e.g., N2).
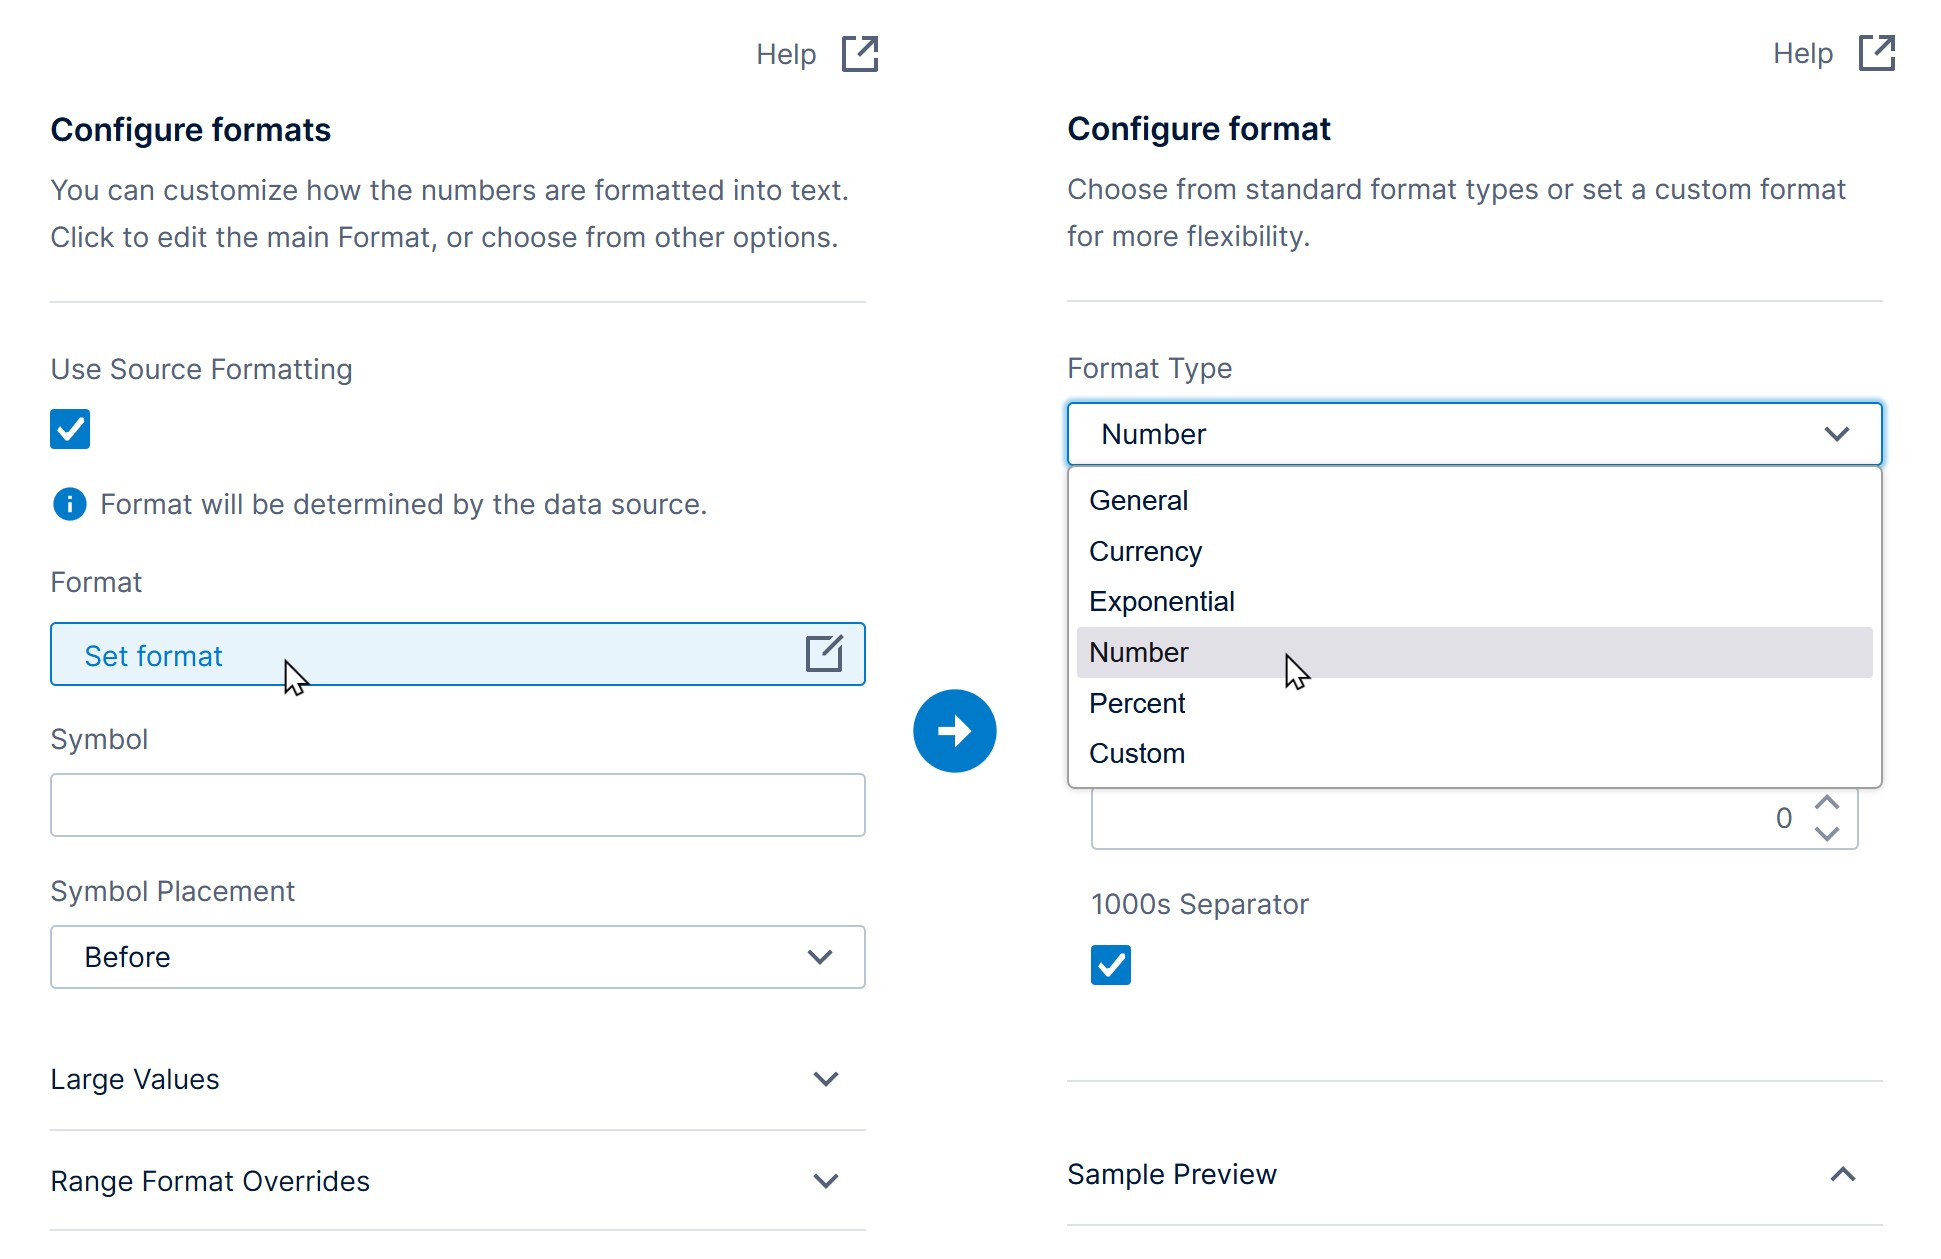
Using the Format Type dropdown in the Configure Format dialog:
- Choose a standard format type like Number or Currency with options such as the number of decimal places. These are designed to automatically display numbers as expected for each user's culture.
- Or choose Custom for more advanced formatting with more control over the result. Enter any custom format or choose one of the common examples from the dropdown menu to the right. (Thousands and decimal separator characters are always determined by the user's culture and not changed by any format settings.)
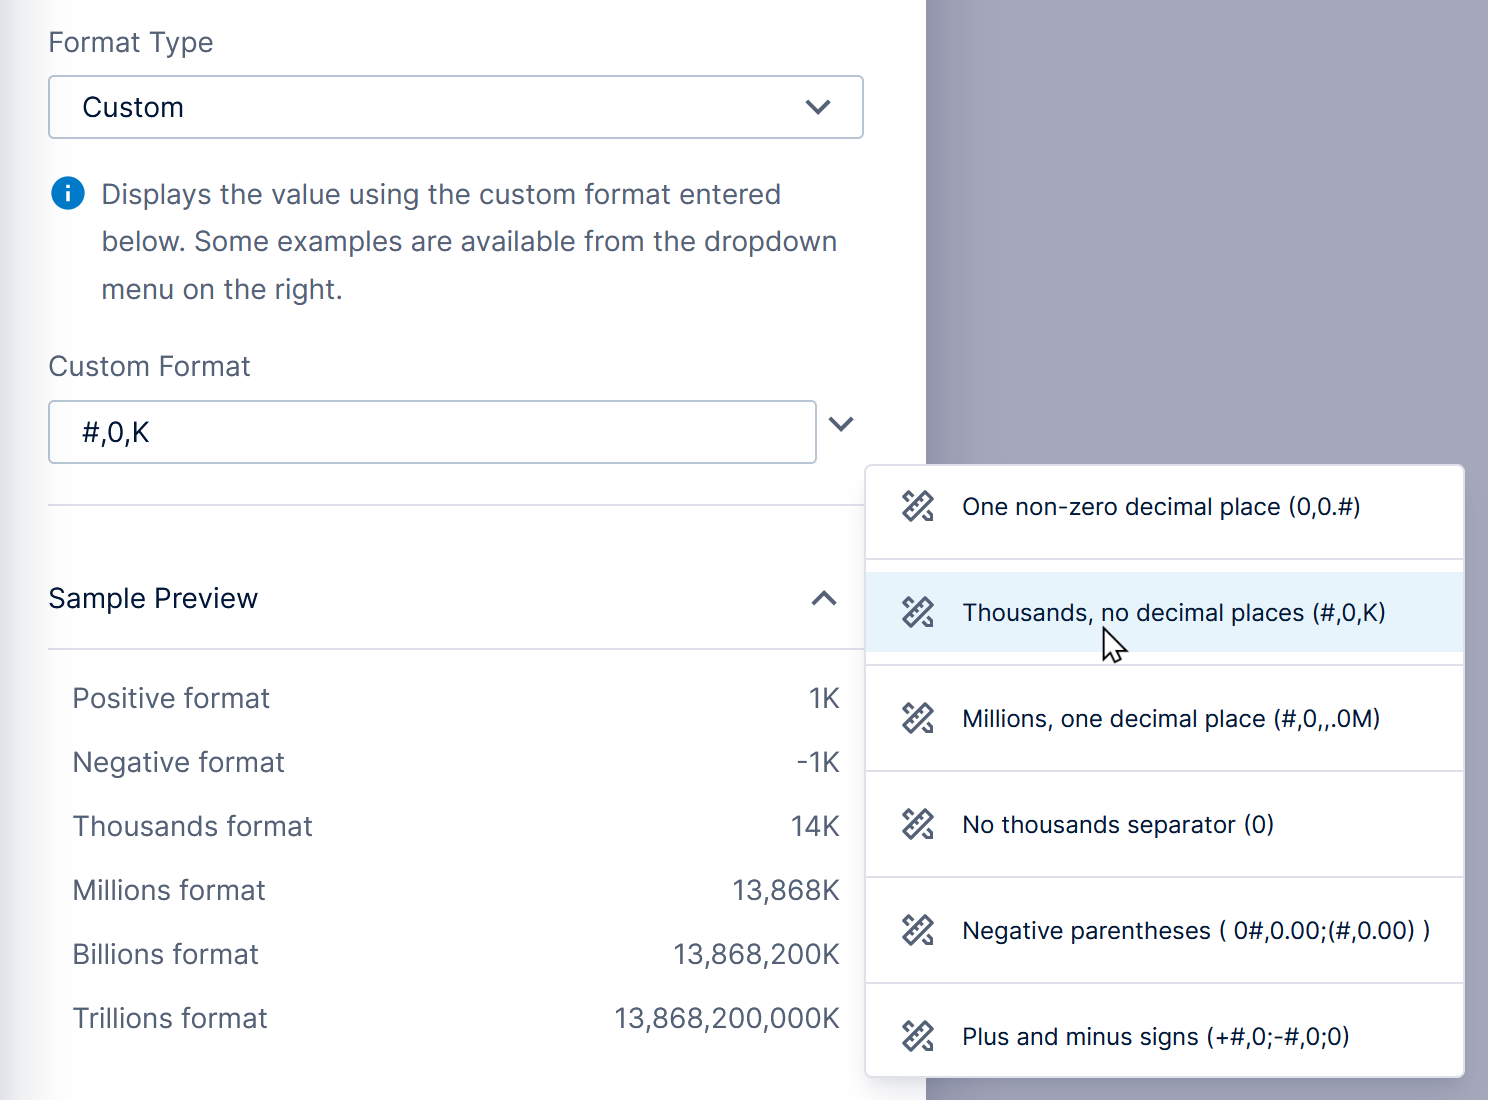
Some common examples of formats are listed below. For more details, see .NET standard numeric format strings and custom numeric format strings.
| Format Type | Format | Sample Text |
|---|---|---|
| Numeric with 5 decimal places | N5 | 80,487,704.17919 |
| Currency with 2 decimal places | C2 | $80,487,704.18 |
| Percent (multiplied by 100) with 0 decimal places | P0 | 8,048,770,418% |
| Exponential/scientific with 2 decimal places | E2 | 8.05E+007 |
| Custom numeric (1 non-zero decimal place) | 0,0.# | 80,487,704.2 |
| Custom numeric (thousands) | #,0,K | 80,488K |
| Custom numeric (millions with 1 decimal place) | #,0,,.0M | 80.5M |
When the Use Source Formatting option is selected at the top of the Configure Formats dialog, the formatting comes from the underlying data source such as a data cube. This is normally unchecked automatically after you have saved changes to the formatting for that element in your metric set.
To apply the same customized formatting to multiple measures at once, click to expand Apply To Other Measures at the bottom, and select the other measures or use the Check All button.
2.1. Formatting currency
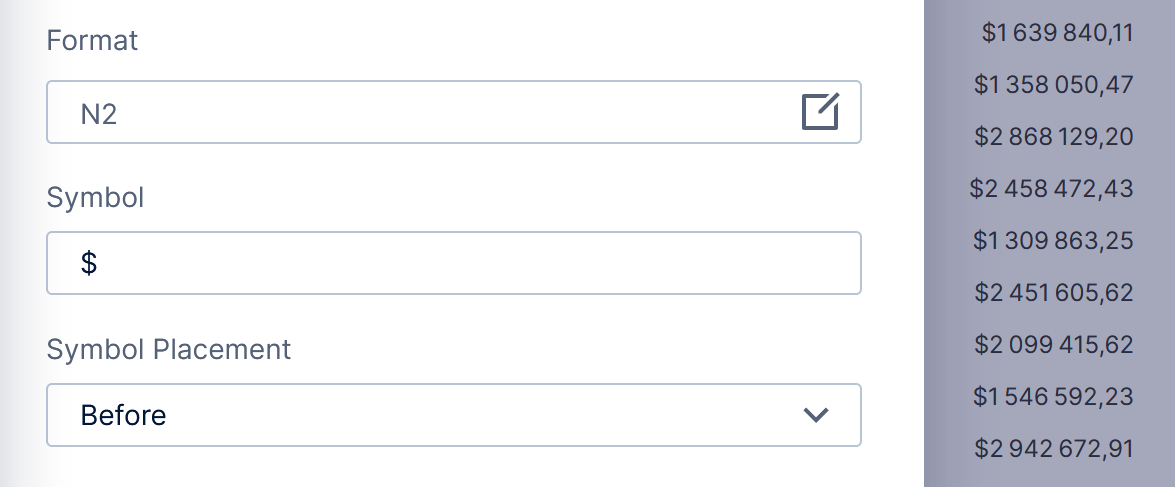
Currency formats can automatically determine where to place the currency symbol according to the user's language and culture settings, as well as the currency symbol itself if you did not set one.
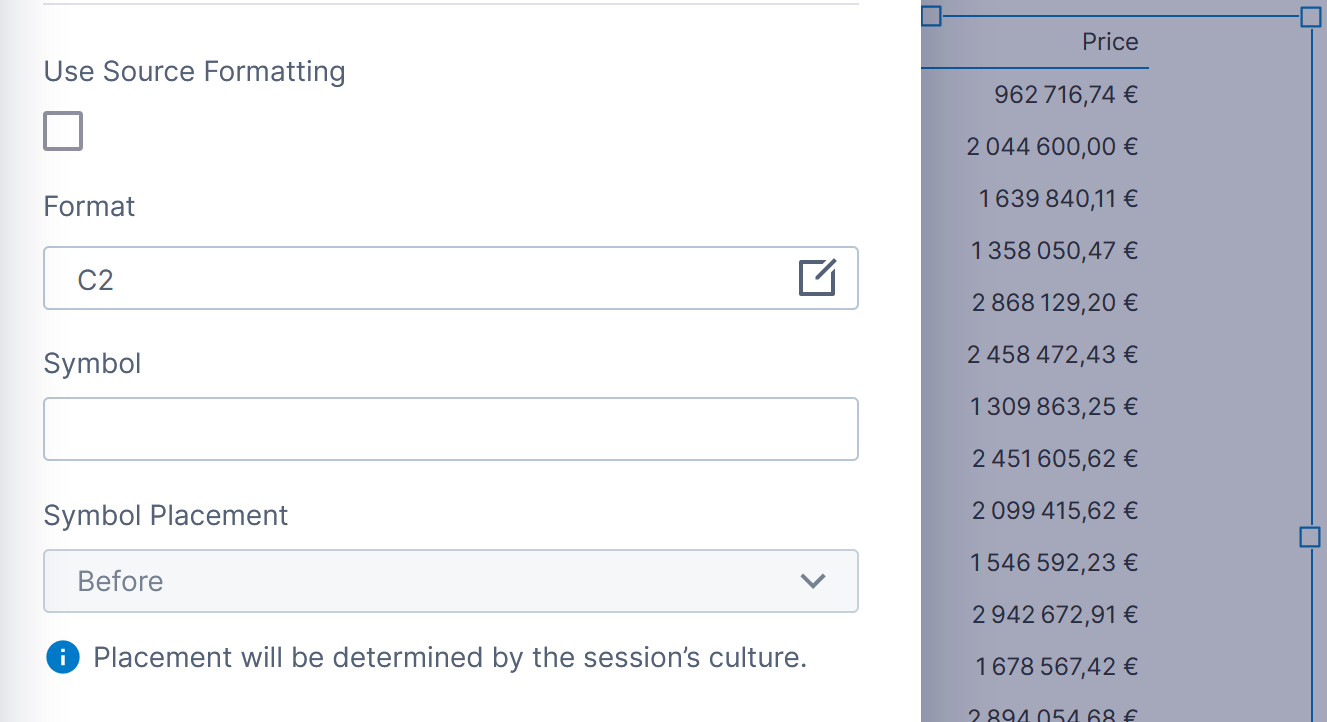
Normally, your values are in a specific currency and you should enter the corresponding Symbol. It will be placed according to each user's culture, but the correct symbol will be displayed for all users.
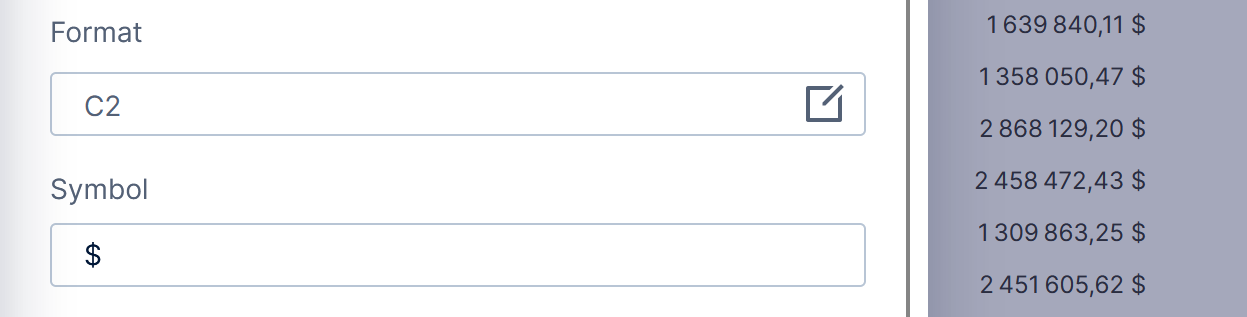
If you prefer to format a value with a specific symbol placement that does not change based on culture, use a non-currency format such as Numeric or 0.00, and specify the placement using the Symbol Placement setting.
2.2. Formatting large values
Numeric values can be further formatted into thousands, millions, billions, or trillions units automatically according to the magnitude of the values as they change.
For example, expand the Large Values section (Additional Format Settings in previous versions), and enter 0K as the Thousands Format. 0 is a placeholder for the corresponding number of thousands, and this displays values larger than one thousand with a K symbol following an appropriately divided value,
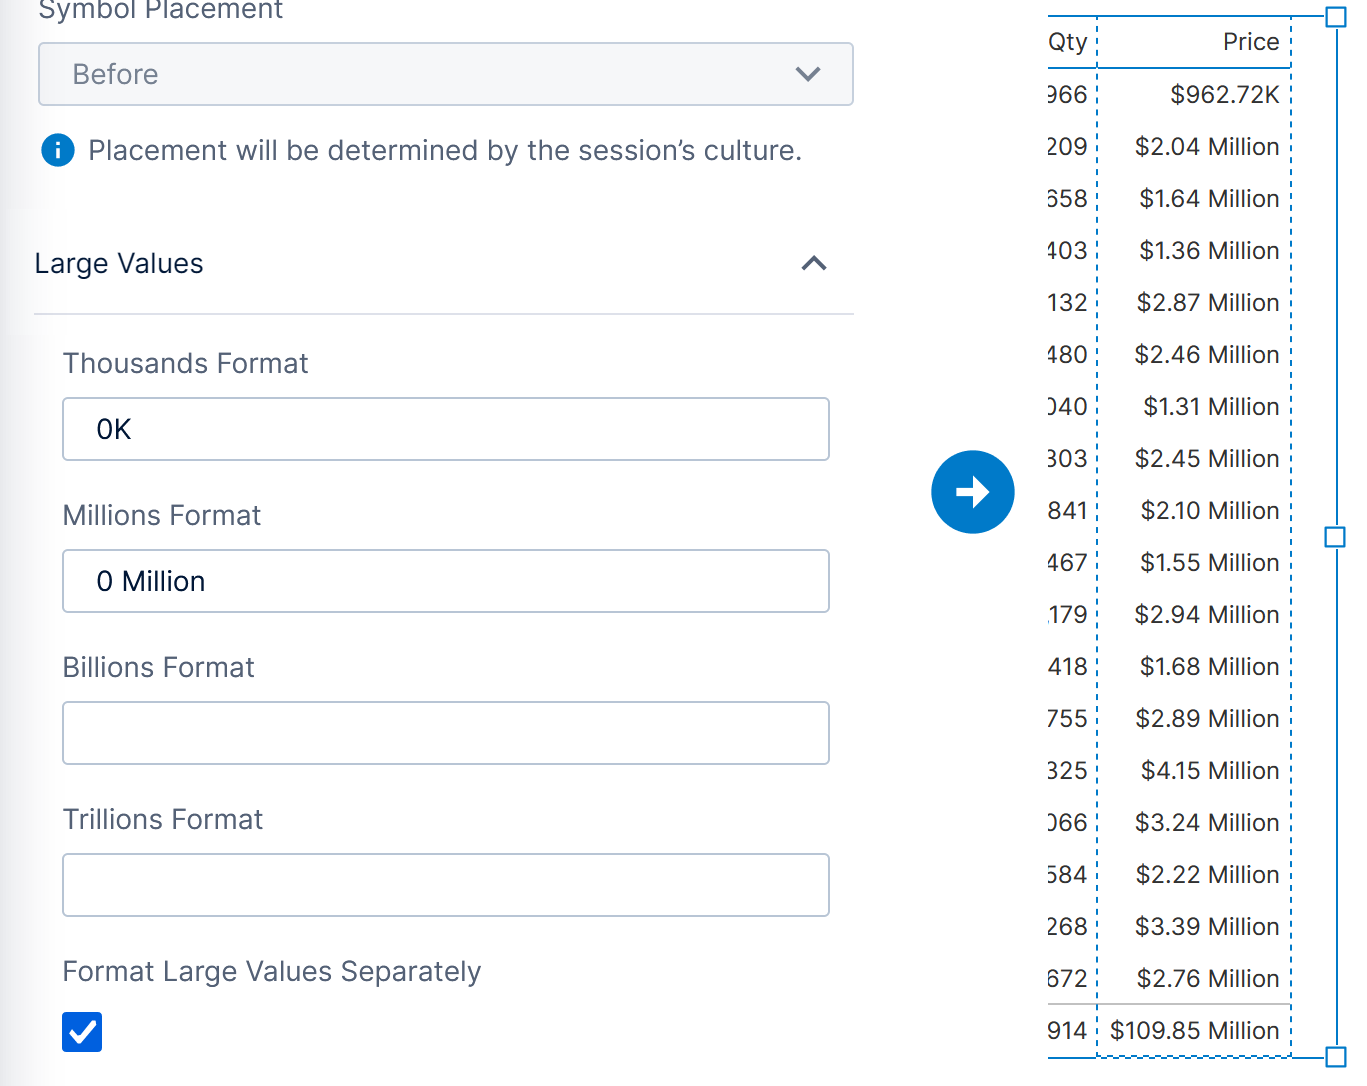
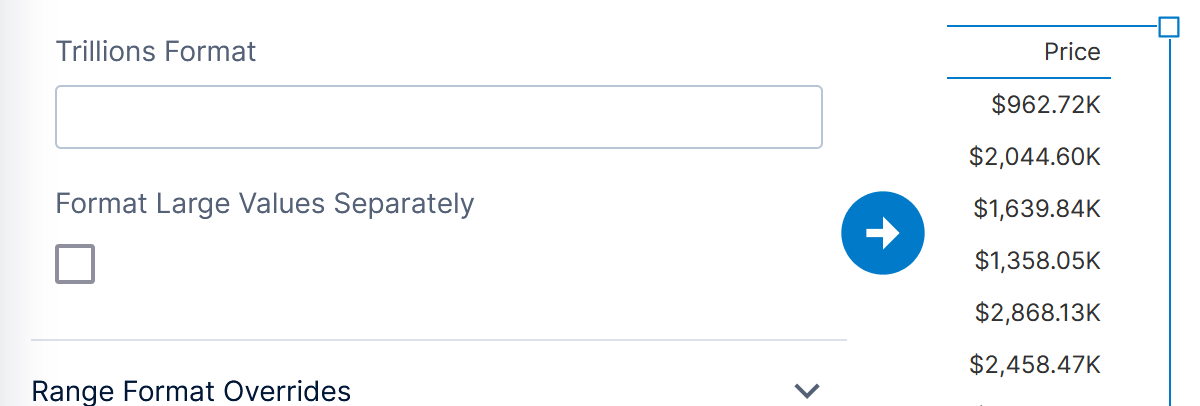
If the Format Large Values Separately option is selected, numbers in different rows or columns can be formatted into different magnitude units as they vary. When this option is unchecked, all numbers displayed at one time use the same unit for easier comparisons.
2.3. Formatting ranges
You can assign different formats to different ranges of values, for example to reduce the number of decimal places for smaller numbers.
To format a specific range, click to expand Range Format Overrides in the Configure Formats dialog, then click Add range format override.
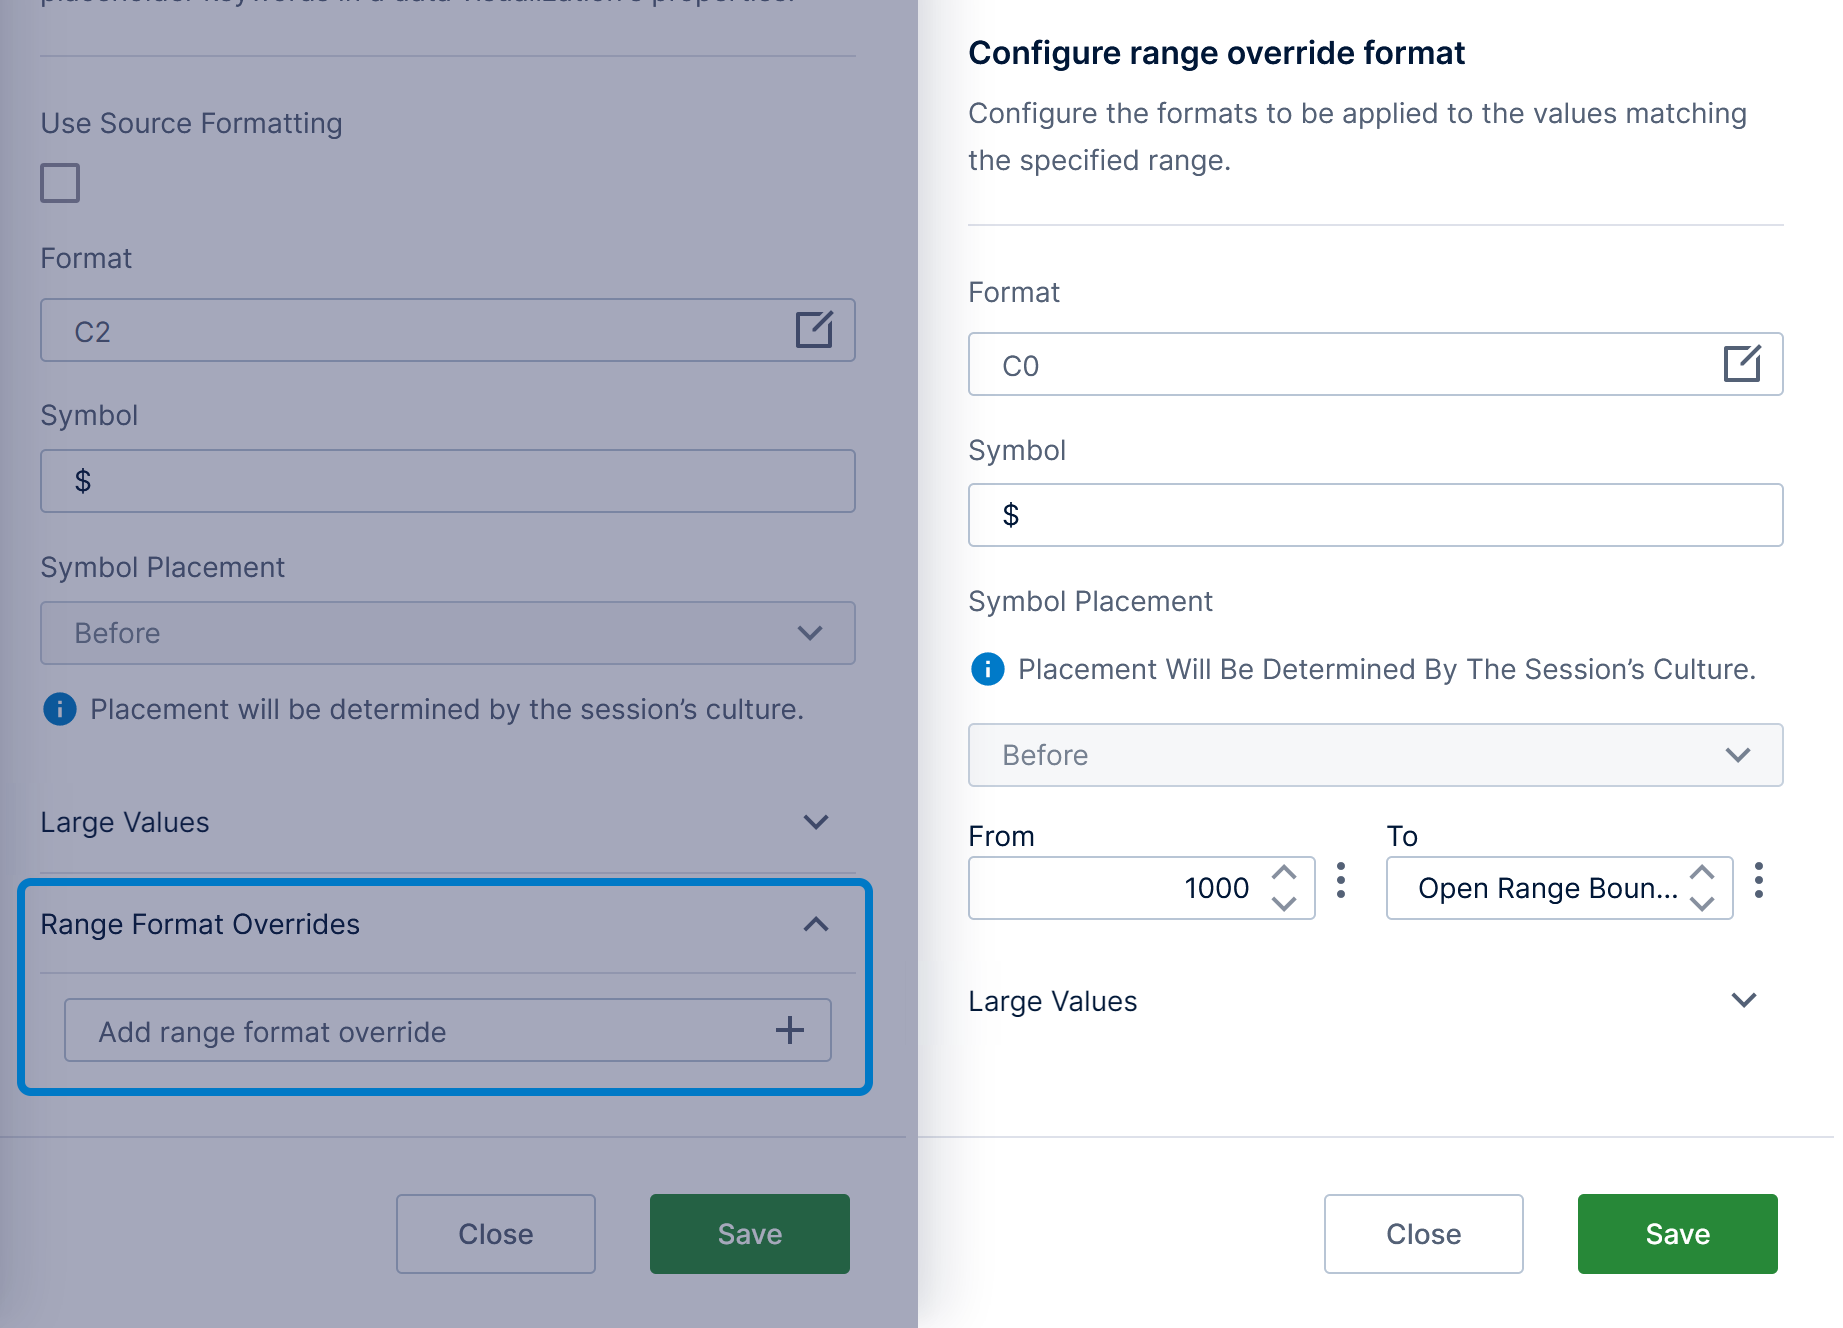
In the Configure Range Override Format dialog for each range, all of the format options described in previous sections are available. Set From and To to determine the value range this formatting is applied to.
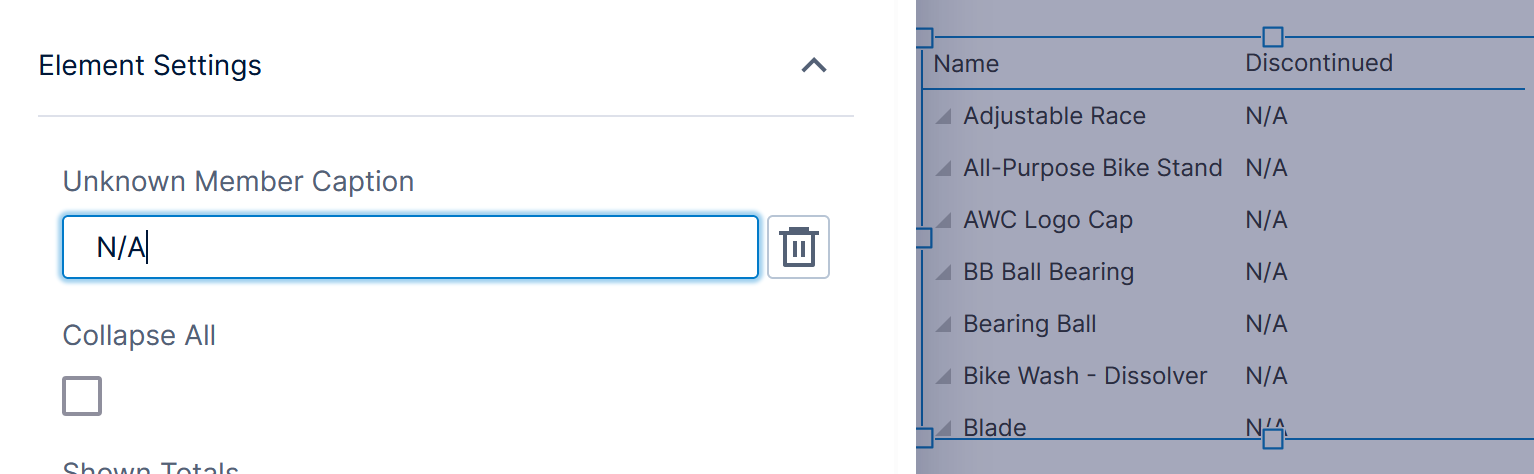
2.4. Formatting unknown values
The caption Unknown displayed for unknown values of a hierarchy can be customized:
Click the orange tile for your hierarchy in the Data Analysis Panel, and set the Unknown Member Caption. In newer versions:
- Click Customize to set a custom caption.
- Enter your custom caption into the text box, or leave it empty to display it that way.
- If you want to display the default caption again, click the delete icon.
When using a missing data rule on a measure with an Output Rule of Empty, there is an Empty Value Text setting that can display text in empty cells instead of leaving them blank.
3. Time dimension formatting
When working with date & time data, it's common to apply a time dimension to group by time periods such as Year and Month, drill down, and more. Time dimensions can be applied to your data in a data cube or in a metric set.
Time dimensions also have formatting options you can customize to change how the dates & times are formatted as text when displayed in your metric sets and visualizations. For details, see Create a time dimension.
4. Placeholder keywords
Various text and tooltip properties of data visualizations can be set with placeholder keywords that will be replaced with actual values from your data when displayed. These property settings are often prepopulated for you using the data assigned in Data Analysis Panel's Visualization tab, but you can optionally customize this property yourself for more options, more control over the formatting, or to combine the keywords with descriptive text.
When you click into one of these properties in the Properties window, a popup will appear suggesting all of the available keywords described below. Click one to insert it into the property at your current position in the text.
You can insert multiple keywords and combine them with any other text or characters you choose to type in.
The most common keywords refer to a measure or hierarchy from the Data Analysis Panel to display its values, enclosing its caption in square brackets. For example: [Order Quantity], using the format defined in the metric set or the time dimension by default.
4.1. Formats
You can optionally edit the keywords used in the Properties window to customize the formatting for numbers or dates/times to be different than what is set up in the metric set or time dimension.
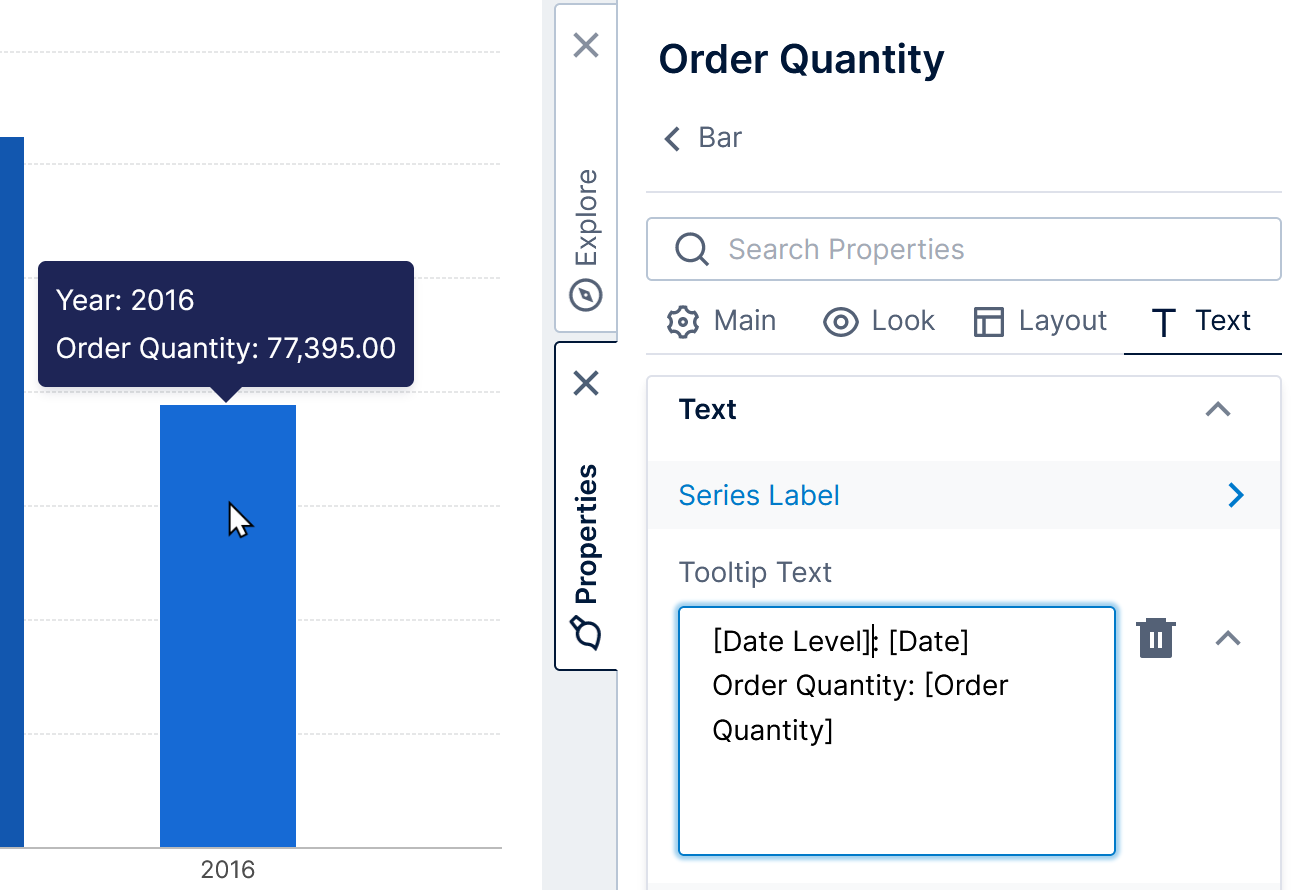
The example below shows a custom format set for the Order Quantity measure displayed in a chart's data point labels:
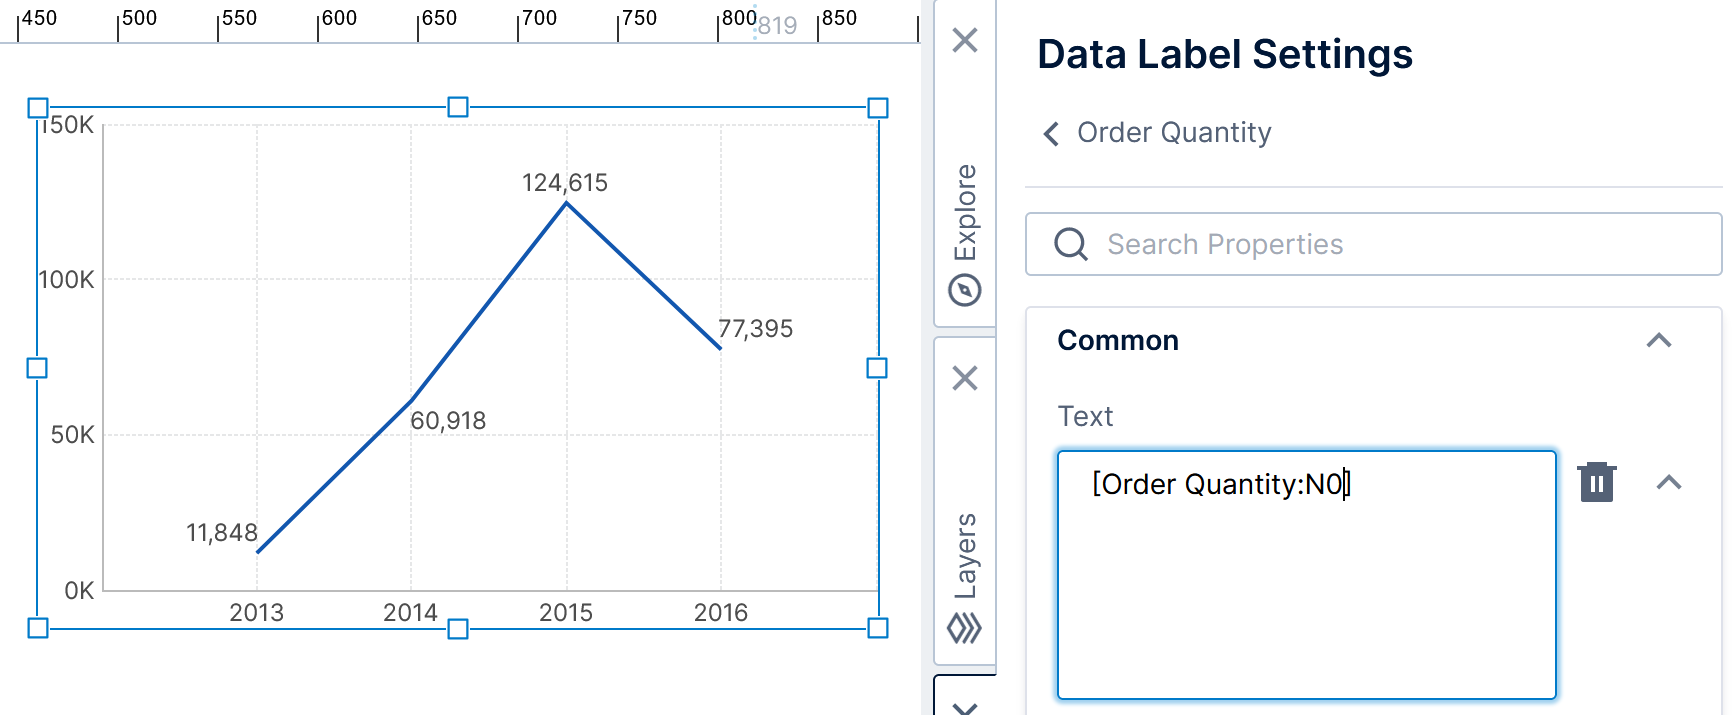
To format a keyword, add a colon and your format before the square closing bracket. For example, to format [Order Quantity] as numeric with no decimal places, change it to [Order Quantity:N0].
When you include the optional format, placeholder keywords support most standard date and time format strings, custom date and time format strings, and standard numeric format strings. (Custom numeric format strings are not supported in visualization keywords.) To customize a hierarchy's formatting, its data type needs to be numeric, date/time, or a time dimension hierarchy, and it should not be placed on Slicers in the Data Analysis Panel.
Examples of numeric formats you can use:
| Format Type | Format |
|---|---|
| Numeric with 2 decimal places | N2 |
| Currency with no decimal places | C0 |
| Percent (multiplied by 100) with 1 decimal place | P1 |
| Whole numbers, 3 digits | D3 |
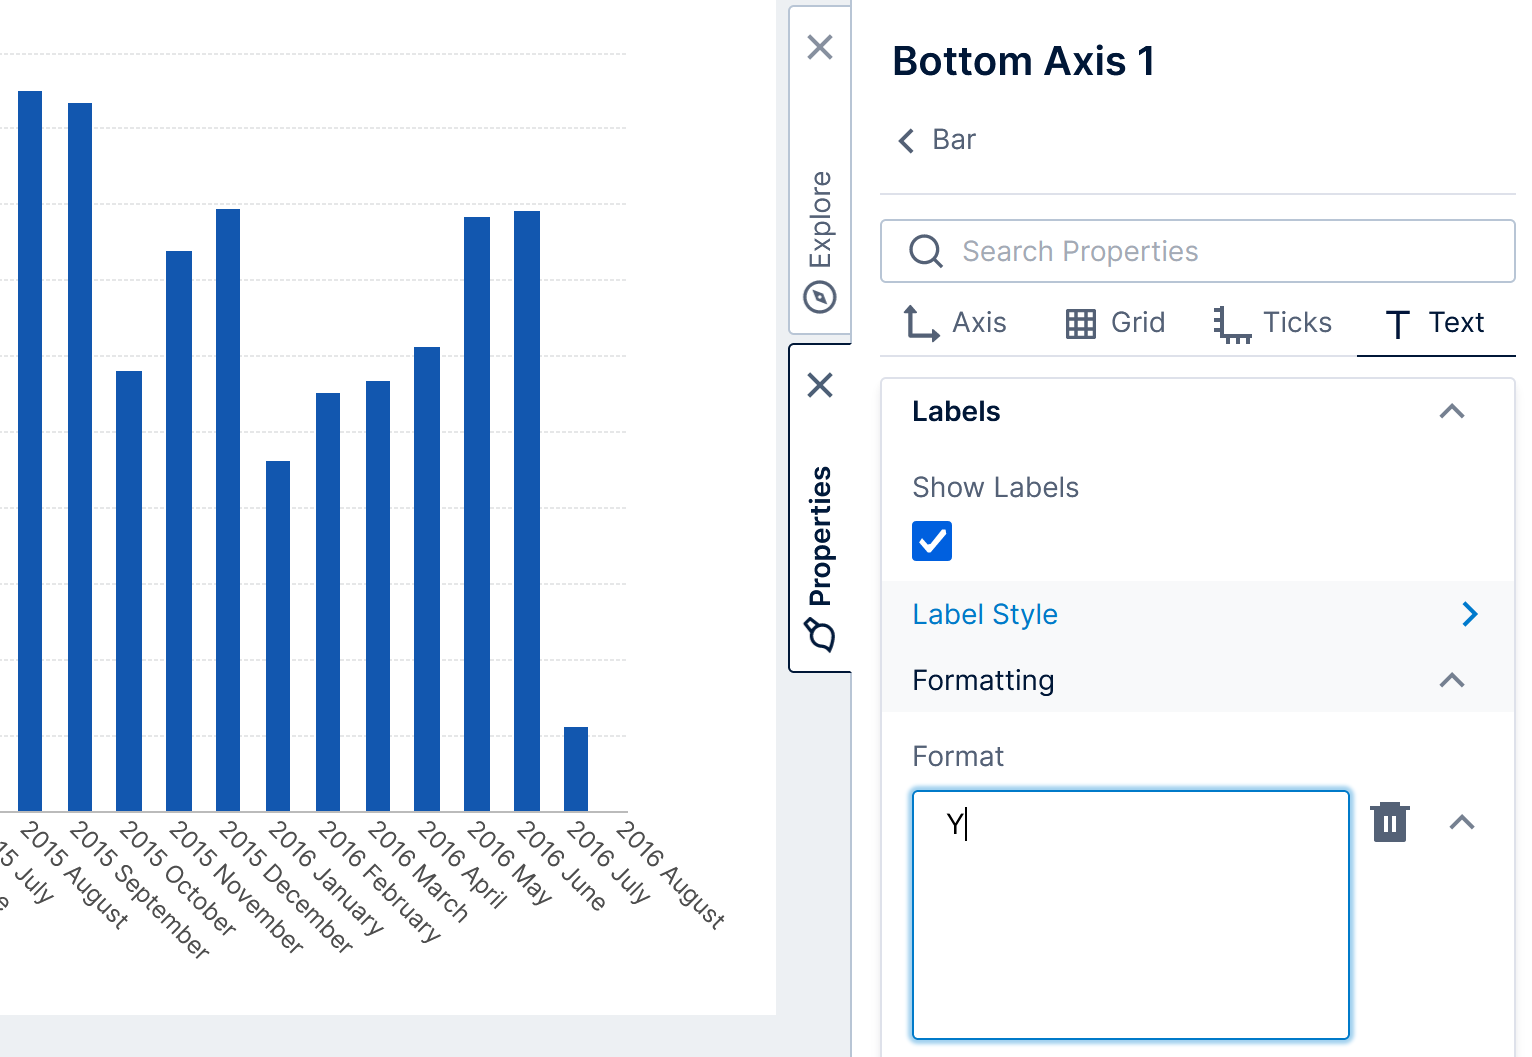
Standard date and time formats are specified by a single character and place their date and time components automatically according to the culture of each logged-in user:
| Standard Format | Specifier | Sample Text |
|---|---|---|
| Short date | d | 6/12/2015 |
| Long date | D | Friday, June 5, 2015 |
| Short time | t | 8:31 AM |
| Long time | T | 8:31:05 AM |
| Long date, short time | f | Friday, June 5, 2015 8:31 AM |
| Long date, long time | F | Friday, June 5, 2015 8:31:05 AM |
| Month/day | M | June 05 |
| Month/year | Y | 2015 June |
Custom formats allow you to place each date and time component yourself. An example of a complete custom format is yyyy-MM-dd.
| Custom Format | Specifier | Sample Text |
|---|---|---|
| Year | y, yy, yyyy | 5, 05, 2005 |
| Month | M, MM, MMM, MMMM | 4, 04, Apr, April |
| Day | d, dd, ddd, dddd | 9, 09, Wed, Wednesday |
| 12-hour clock | h, hh | 9, 09 |
| 24-hour clock | H, HH | 9, 09 & 21, 21 |
| Minutes | m, mm | 6, 06 |
| Seconds | s, ss | 8, 08 |
| AM/PM | t, tt | a, AM |
| Fractional seconds | f, ff, fff | 6, 61, 611 |
| Literal text | 'My Text' | My Text |
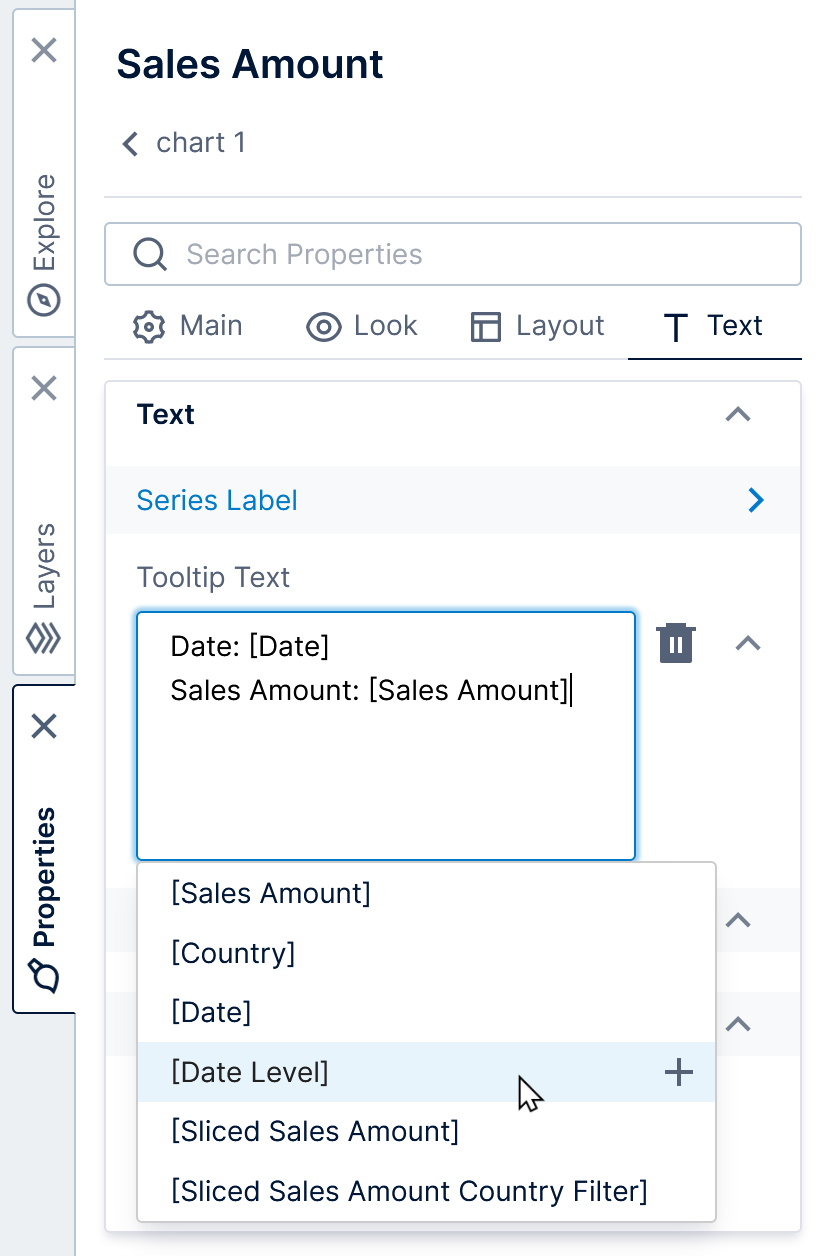
4.2. Filter and level keywords
By default, visualization tooltips identify the data by its hierarchy caption, for example the caption Date regardless of whether the hierarchy level Year or Month is displayed from a time dimension.
If you want to display the caption of the hierarchy level, use the keyword [<Hierarchy> Level], replacing <Hierarchy> with your hierarchy name. For example: [Date Level].
You can display filter values for data placed on slicers as a regular keyword.
When using a slicer comparison measure, you can also display the filter values determining the 'sliced' measure values using the keyword [<Sliced Measure> <Slicer Hierarchy> Filter]. For a slicer comparison measure with the caption Sliced Sales Amount filtered by the slicer Country, for example, you can display the particular country used to filter the sales amounts using [Sliced Sales Amount Country Filter].
The following keywords can be used in text properties when using a Dynamic Element filter, replacing <Dynamic Measure> or <Dynamic Hierarchy> with the name of your particular dynamic measure or dynamic hierarchy:
| Keyword | Description |
|---|---|
| [<Dynamic Measure> Caption] | The caption of the actual measure currently displayed by the dynamic measure. |
| [<Dynamic Measure>] | Represents the numeric values of the current dynamic measure. |
| [<Dynamic Hierarchy> Level] | The caption of the actual hierarchy or hierarchy level displayed by the dynamic hierarchy. |
| [<Dynamic Hierarchy>] | Represents the captions/values of the current dynamic hierarchy. |
4.3. Visualization keywords
In addition to measure and hierarchy keywords, the following keywords may be available depending on the visualization, and will be suggested in the popup when you edit a text property:
| Keyword | Visualization | Description |
|---|---|---|
| [Total] | Stacked and 100% stacked charts, pie charts | Displays the stacked total up to and including that data point from zero or a pie's start angle. |
| [Percent] | 100% stacked charts, pie charts | Displays the percent of the data point's value out of its stack total. |
| [Measure Name], [Measure Value] | Charts or tables displaying a transposed metric set | The measure name or value displayed by each data point or in each row. |
| [Member] | Pie chart, waterfall chart, charts with Hide Total Values unchecked, tables (custom total text), treemaps, tree diagrams, relationship/Sankey/chord diagrams (nodes) | The hierarchy member caption. In a table's custom total/subtotal text, displays the hierarchy's All caption, which can be set in a data cube's Process Result. |
| [Level] | Treemaps, tree diagrams, relationship/Sankey diagrams (nodes) | The hierarchy level caption. |
| [Size] | Treemaps | The value of the measure used to determine the node size. |
| [SizeMeasure] | Treemaps | The name of the measure used to determine the node size. |
| [Flow] | Sankey diagrams (nodes) | The total quantity flowing in or out of the node. |
| [Source] | Sankey diagrams (links), chord diagrams (links) | The source hierarchy member caption. |
| [SourceValue] | Chord diagrams (links) | The quantity of the flow from the source to the target. |
| [Target] | Sankey diagrams (links), chord diagrams (links) | The target hierarchy member caption. |
| [TargetValue] | Chord diagrams (links) | The quantity of the flow from the target to the source (if applicable). |
| [Value] | Chord diagrams (nodes) | The total quantity flowing out of the node. |
4.4. Size and color rule keywords
The following keywords are supported for the legend text property of size and color rules (i.e., Range Size Rule, Auto Size Rule, Range Color Rule, and Auto Color Rule) in any visualization.
| Keyword | Description |
|---|---|
| [From] | The starting value in the range. |
| [To] | The ending value in the range. |
5. Format properties
Dedicated format properties in data visualizations such as on chart axes and gauge scales support the same formats as visualization keywords (and have the same restrictions).
Axes and scales have a Symbol property below the format similar to the settings on measures. When applying currency formatting, it is best to set this to the currency symbol for your data as shown above for measures so that it is displayed consistently for users logged in with different language or culture settings.