
1. Overview
This article shows you how to add a count measure to display the number of records or values behind each row or column.
2. Adding a count measure
A count measure displays the number of records making up each row or column. This can be added to any metric set except those displaying data from an OLAP cube.
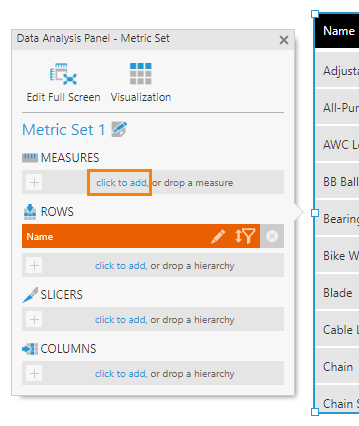
Under Measures in the Data Analysis Panel, click to add a measure.
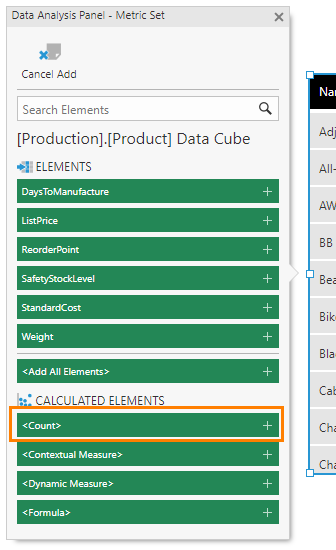
In the list of available measures you can add, scroll down to the Calculated Elements section and click <Count>.
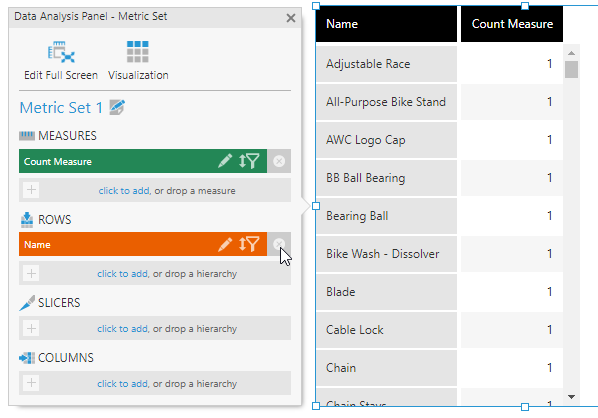
A Count measure is added to the Data Analysis Panel and your visualization.
In our example below, all of the original product records are displayed so the count is 1 in every row, but this would change if the data is grouped differently by removing Name or replacing it with a different hierarchy.
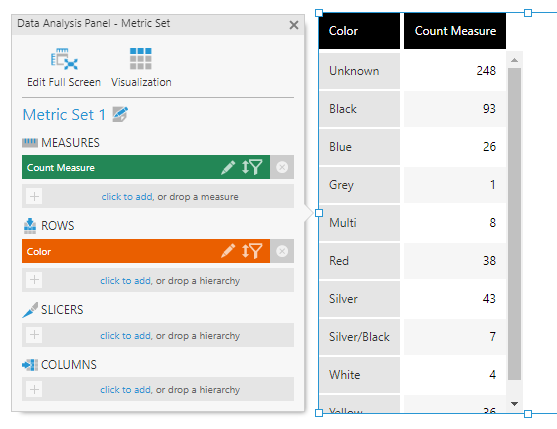
The following example shows the number of product table records for each Color:
3. Add a hierarchy count measure
A hierarchy count measure displays either the total number of values (Count) or the number of distinct values (Distinct Count) present for a particular hierarchy or non-numeric column.
To add a hierarchy count measure, drag a hierarchy or a column of non-numeric data from the Explore window to Measures in the Data Analysis Panel.
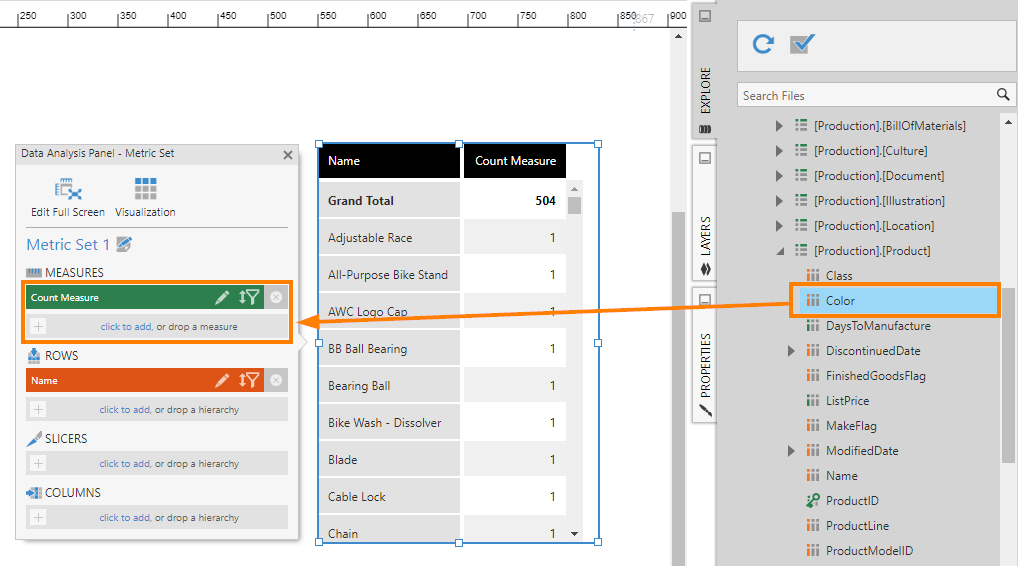
A count measure will be automatically created and named based on the name of the hierarchy, e.g., Color Count.
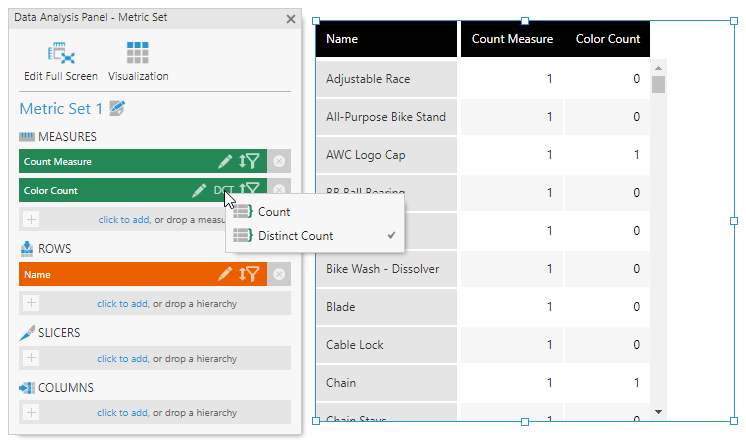
By default, the aggregator for a hierarchy count is set to Distinct Count, in this example displaying the number of distinct colors available for each product (sometimes none or null).
To quickly change the aggregator, click the abbreviated aggregator name shown for the measure in the Data Analysis Panel (e.g., DCT) and choose a different one from the popup.
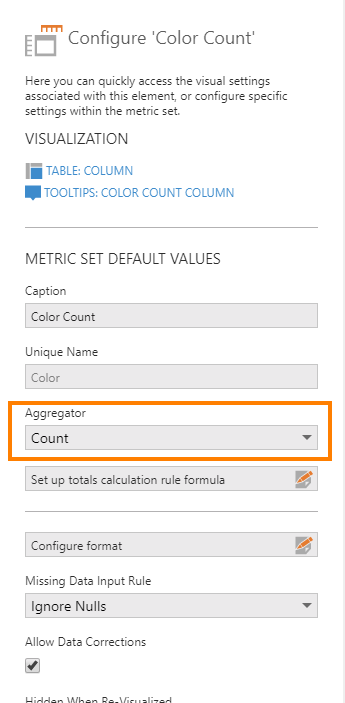
Alternatively, click the Edit icon for the measure to open its full configuration dialog, and change the Aggregator.
You can add multiple hierarchy count measures for the same hierarchy in version 10 and higher if you want to use multiple aggregators at once.
4. Notes
- Automatic count measures are not supported when displaying data from an OLAP cube. The hierarchy count measures described above are supported, as well as count measures created in the OLAP cube.
- The available aggregators for both measures and hierarchy count measures can be changed in the data cube.
- Totals are not retrieved from OLAP when using hierarchy count measures together with top/bottom settings.