The wait is over – Dundas BI 5 is here! With this release comes over 150 new features and enhancements to ensure unlimited analytics possibilities are made even easier.
Forecasting & Clustering
With Dundas BI 5, we’re providing the ability to boost your predictive analytics with new forecasting formulas that capture the evolving trend or seasonality of data to predict the future, and new clustering formula to classify new data.
Our new Exponential Smoothing formulas apply an exponentially-decreasing weight to historical data in order to forecast future values based on emerging trends. In other words, this means that when using this function, recent observations are given relatively more weight in forecasting than older observations.
Exponential Smoothing in Dundas BI
The new Clustering function uses the K-Means algorithm to categorize data points into groups based on similarity of the variables provided. This method of clustering has been successfully implemented in various topics, including market segmentation, computer vision, geostatistics, astronomy and agriculture. So the next time you need to identify different groups in your data that should receive special treatment (for example, a defined custom marketing campaign for a certain cluster), look no further!
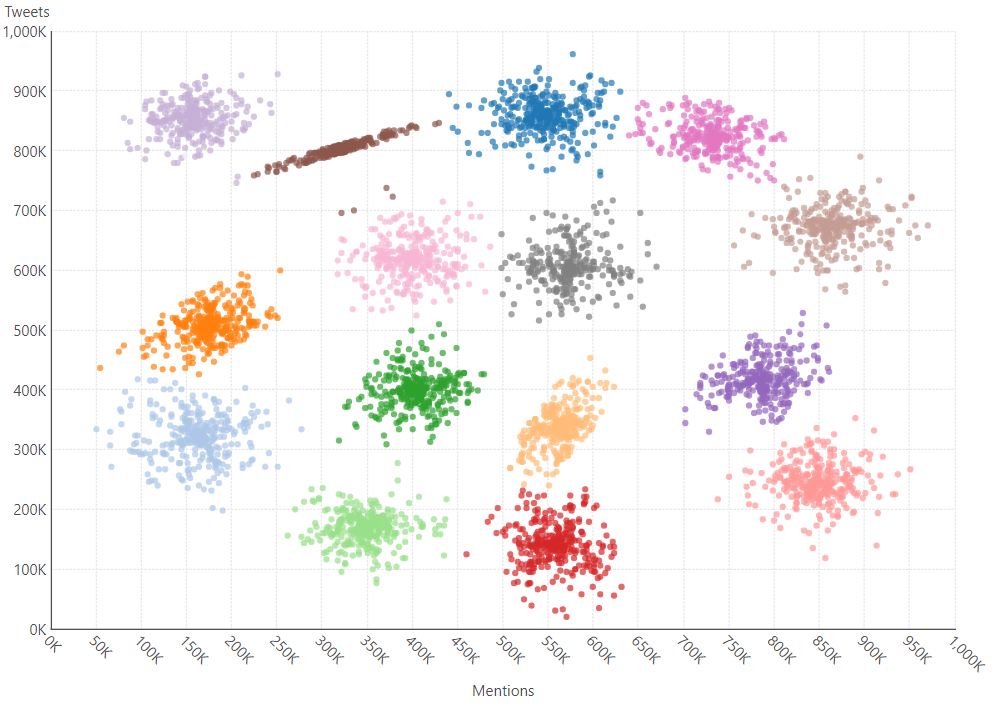
K-Means Clustering in Dundas BI
Python
When releasing Dundas BI 5, an objective of ours was to ensure we tackled complex integrations, so that deploying Dundas BI seamlessly within your overall technology stack would become a simple matter of tweaking a few settings. One thing we’re really excited about, is the addition of Python in Dundas BI. With this new capability, you’re now able to run your own Python script within Dundas BI and have Python’s best machine-learning (AI) libraries analyze your data, while Dundas BI visualizes it.
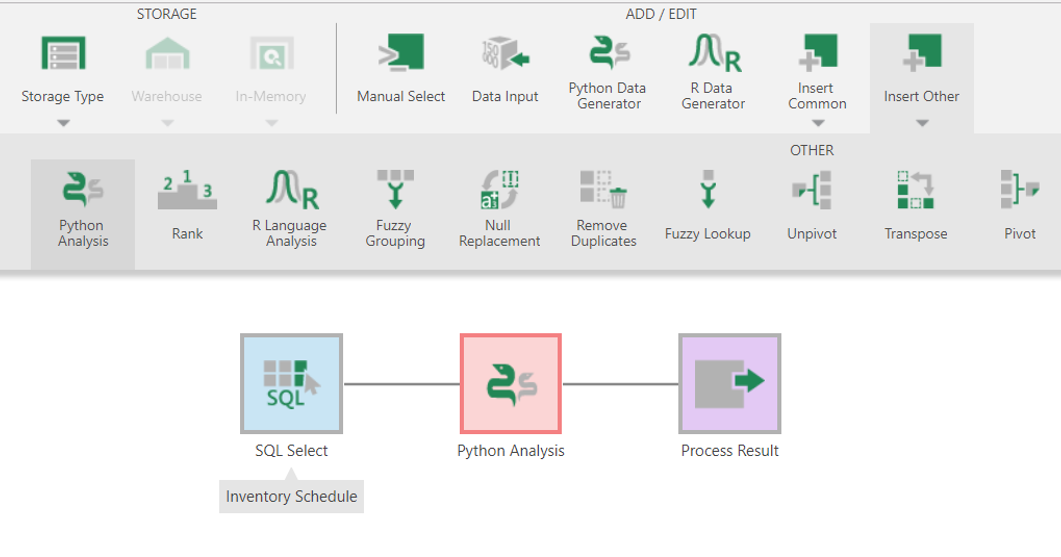
Python in Dundas BI
Try Dundas BI 5 today to take advantage of Forecasting, Clustering, and Python, and other exciting features that are now available.
You can learn more about additional Dundas BI 5 features like Tree and Chord Diagrams, Heat Maps, Incremental Data Storage, PostgreSQL Deployment, and more by visiting our Dundas BI 5 features page.
About the Author

Jordan Zenko is the Community & Content Manager at Dundas Data Visualization. As Dundas’ resident (and self-proclaimed) story-teller, he authors in-depth content that educates developers, analysts, and business users on the benefits of business intelligence.
Follow on Linkedin
Follow Us
Support