
Sorting and filtering a report or scorecard
1. Overview
This article shows various ways to sort and filter rows in a report or scorecard. These options are also similar for small multiples.
Reports and scorecards use their own metric set to determine the rows they display and their order, which you can sort and filter like you can a normal metric set.
2. Sort & filter while editing
When editing a report or scorecard, you can change the sorting and filtering to determine the settings that take effect when first viewed.
Click the Data Analysis Panel icon to the left of the grouping area to open this panel for that group's metric set.
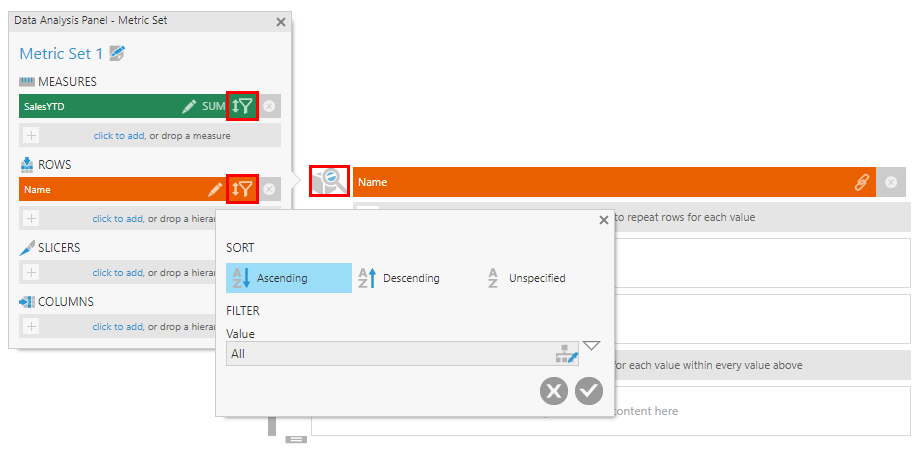
You can then click the sort & filter icon for any measure or hierarchy to sort or filter the report or scorecard by its values.
If the measure or hierarchy you want to sort or filter by is not already selected, you can add it here. For example, you can click to add data from the same data source or a new formula, or drag data from the Explore window.
Add a hierarchy to Slicers if it's meant only for filtering. If you add a measure, a data label will initially be added to display its values, but you can edit the measure and select its Hidden option or delete the data label if you intend only to sort or filter by its values.
After opening the group's Data Analysis Panel, the group metric set becomes selected as indicated by the blue outline around the clicked icon. When selected, you can preview the report/scorecard data and its sorting by opening the Data Preview window at the bottom of the screen.
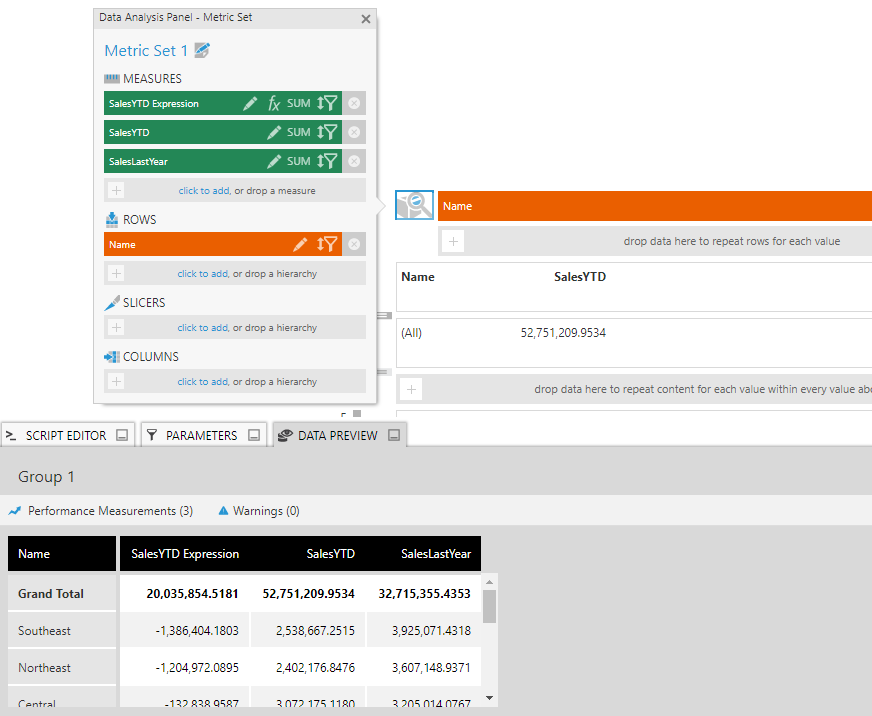
Using this Data Analysis Panel, you can also use other metric set tools, including top/bottom N filtering, custom measure sorting and custom hierarchy sorting.
3. Add a filter
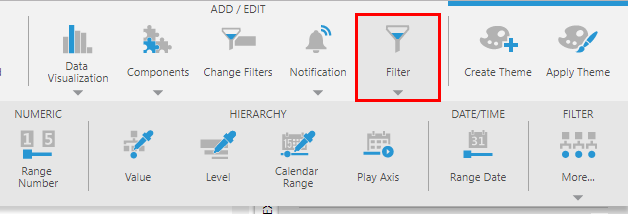
To allow the filtering to be changed while viewing, you can add filters to the parameters bar by clicking Filter in the toolbar, then choosing a filter type.
In a similar way to a dashboard, a view parameter is created together with the filter and is automatically connected to some compatible data, but your filters will be displayed in the parameter bar at the top of the screen. The Parameters window opens below with the view parameter's details, which you can review.
Change the Name to determine the label that appears above the filter in the parameter bar, then scroll down to confirm which hierarchies or measures are connected to this filter.
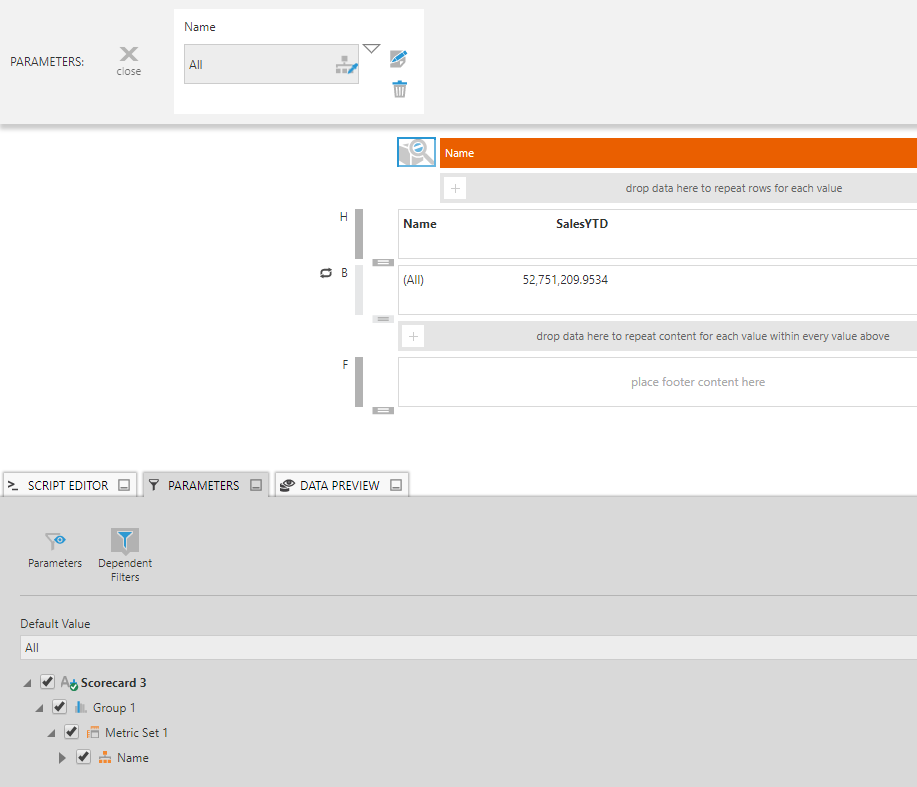
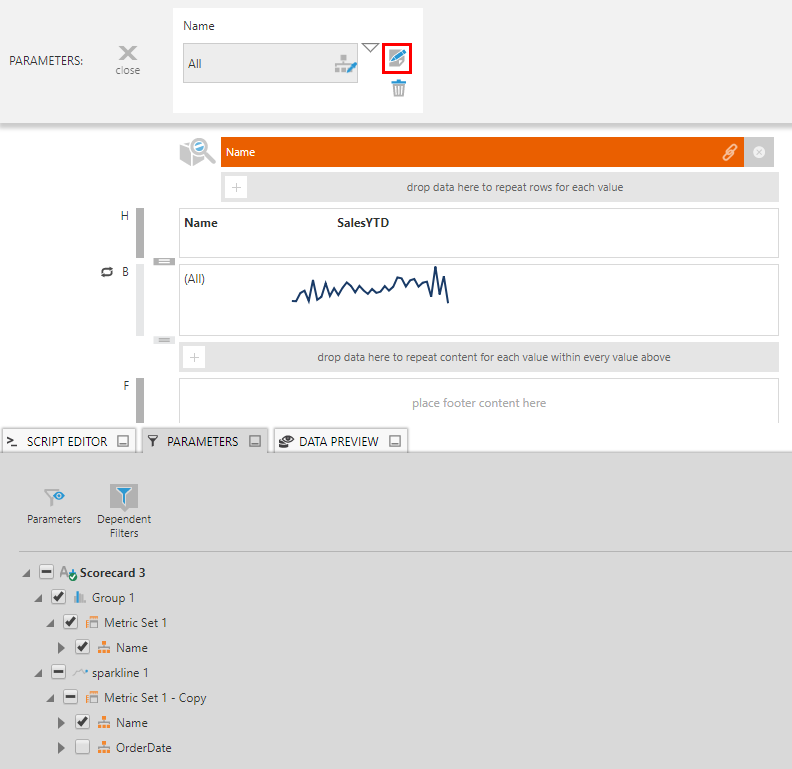
To filter the rows of the report or scorecard itself, the group metric set's hierarchy should be selected as in the image above (i.e., under Group 1).
Switch to View mode. In the toolbar (or using the right-click context menu), click Change Filters to open the parameter bar and use the filter.
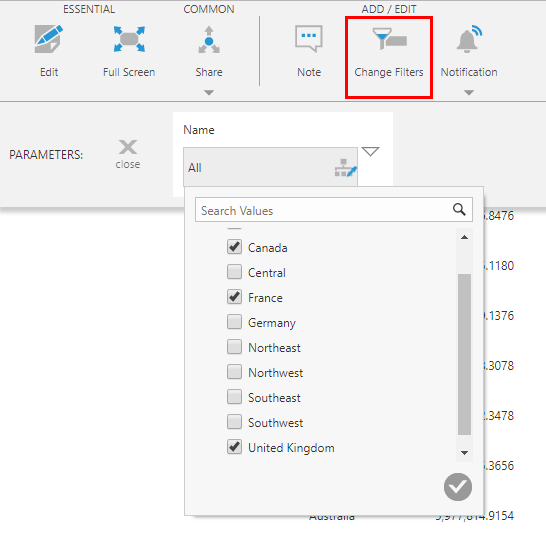
See Adding filters for more information on the types of filters available.
3.1. Filtering visualizations
Data visualizations may select data separately from the report or scorecard grouping, especially when they display multiple rows or data points within each visualization (e.g., a line chart). In this case, they appear separately in the Parameters window from the report or scorecard groupings. (Visualizations that display data from the group metric set will indicate this in their Data Analysis Panel.)
Your filter must be connected to each visualization's metric set in order to filter its data. To edit the connections, re-open the parameter bar by choosing Change Filters in the toolbar, then click the Edit icon next to your filter.
Scroll down the Parameters window to your data and connect the filter to whichever visualizations should be affected.
4. Header controls
You can add header controls to your report or scorecard to allow users to sort and filter the rows in View mode. This functionality is similar to using column headers for sorting and filtering a table visualization.
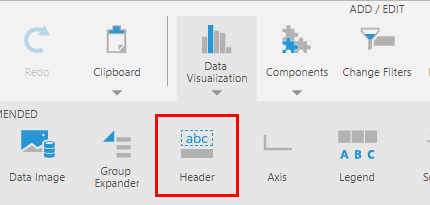
Headers are often created for you automatically when you first add data to the report or scorecard. You can also add one yourself by clicking Data Visualization in the toolbar and choosing Header.
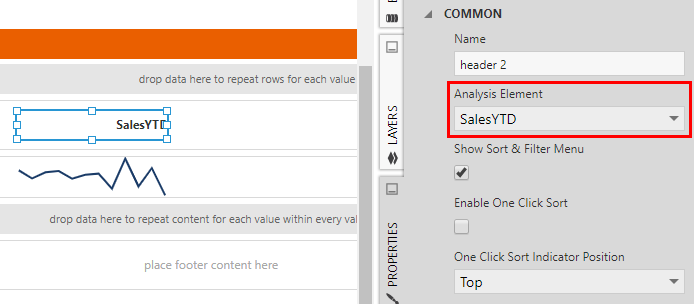
Once added, open the Properties window and set its Analysis Element. The text of the header will automatically update to reflect the name of the chosen element.
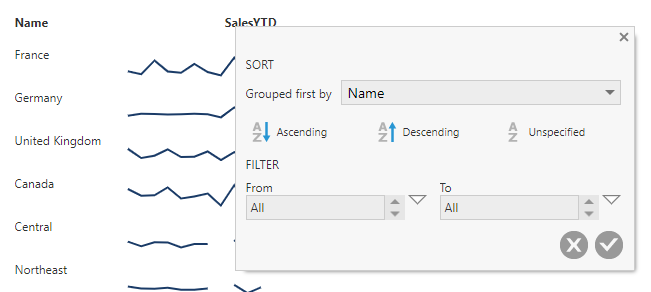
When viewing, hover over a header and click the A-Z icon to access its sort & filter popup.
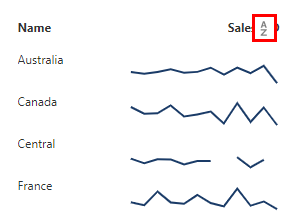
A sort & filter popup appears, which works the same as for a table visualization's headers.
You can find more details and examples about how sorting works with hierarchies, measures, and grouping in the article Sorting a table visualization.
4.1. One click sorting
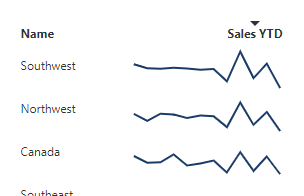
The header control also supports one-click sorting, which allows you to click the header to immediately sort the rows in ascending, descending, or unspecified order.
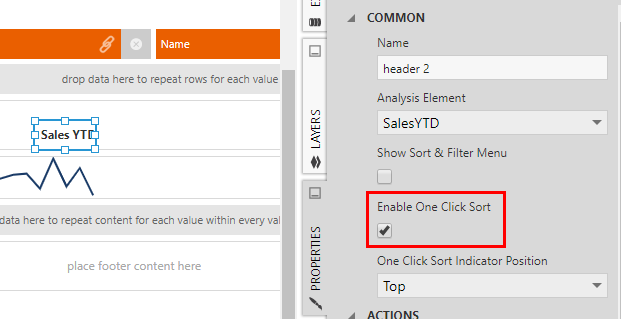
To use this option, go to Properties for the header control and select Enable One Click Sort.
A triangle icon above the header text tells you the current sort direction. If you do not see the icon, it means the sort direction is unspecified.
5. See also
- Report basics and concepts
- Building a scorecard
- Design tips for reports and scorecards
- Creating small multiples
- Adding filters
- Filter child dashboards from a parent dashboard
- Sorting a table visualization
- Metric set analysis tools
- Displaying top/bottom records
- Define custom measure sorting
- Define custom hierarchy sorting