1. Overview
This article shows you how to sort the data in your metric set by measure values using the dialog available from the Data Analysis Panel. For example, you could sort your Sales measure's figures for each Product from largest to smallest.
This dialog allows you to sort one specific hierarchy level by a measure, and when applicable you can set the opposite axis members from a dropdown.
2. Defining custom measure sorting
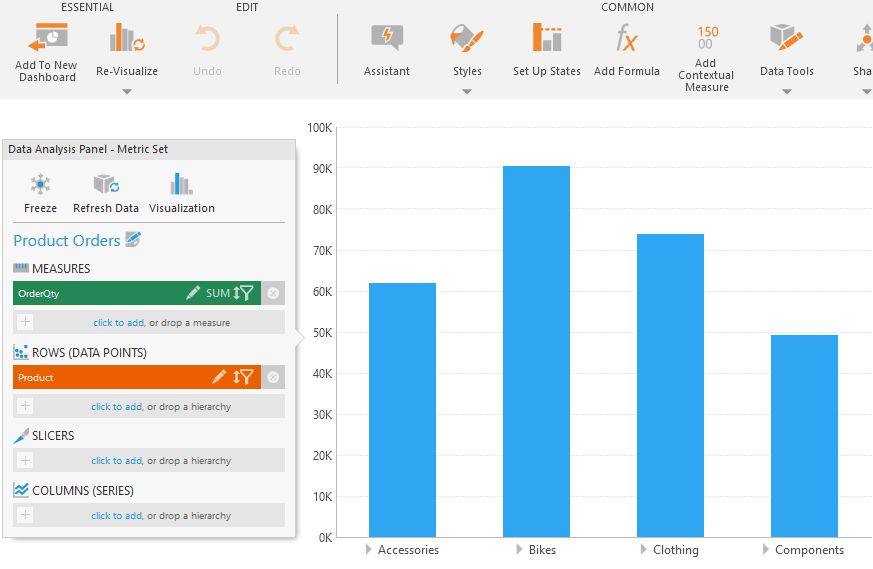
As an example, we have a metric set configured with one measure OrderQty, and a Product hierarchy under Rows.
From the toolbar, we re-visualized the metric set as a bar chart and observe that the OrderQty measure values are unsorted along the Product hierarchy.
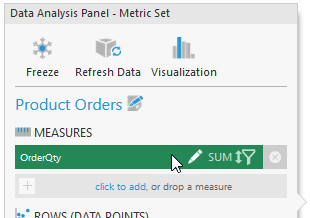
In the Data Analysis Panel, click on the OrderQty measure to edit it.
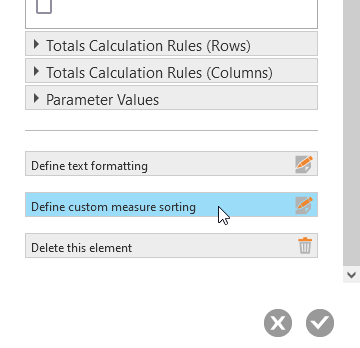
In the Configure Element dialog that opens, scroll down and click Define custom measure sorting.
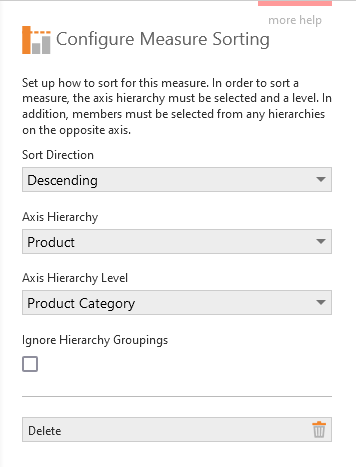
In the Configure Measure Sorting dialog, set the following options:
- Choose a Sort Direction. For this example, set it to Descending so that measure values will go from largest to smallest.
- Select the Axis Hierarchy. This is the hierarchy values your want to be sorted by your measure, such as Product.
- Select the Axis Hierarchy Level. Choose a which level of the hierarchy to sort by the measure when there are multiple, such as Product Category.
- If you need to sort all rows by this measure independently of any groupings (including totals), select Ignore Hierarchy Groupings.
Click the Submit button at the bottom of the dialogs to save your changes.
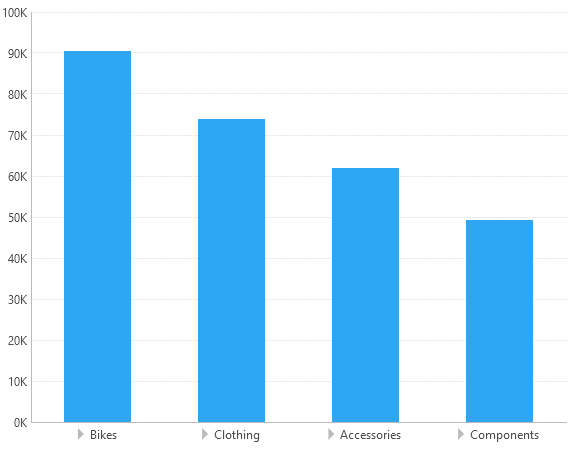
Observe that the OrderQty values for the Product Category data points in the chart are now sorted from largest to smallest.
3. Opposite axis hierarchies
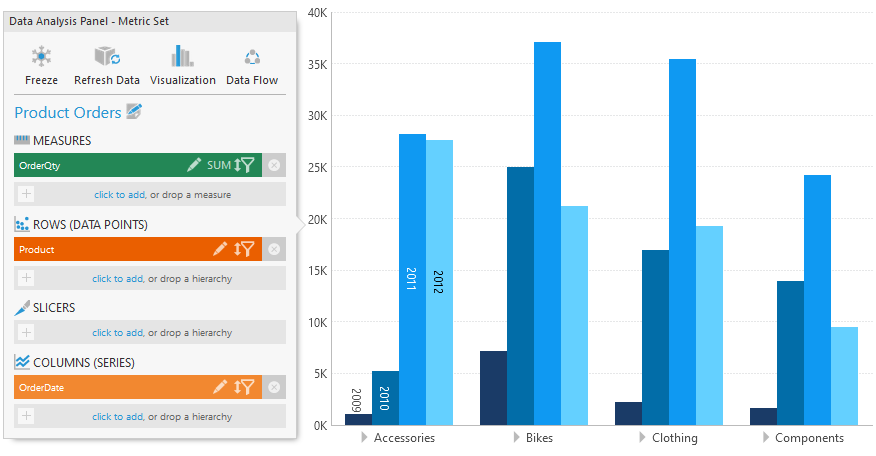
When sorting the rows or data points of your metric set by a measure, for example, you might have a hierarchy under Columns in the Data Analysis Panel that splits your measure values into multiple columns or series. In this case, you would need to decide which column or series to sort by.
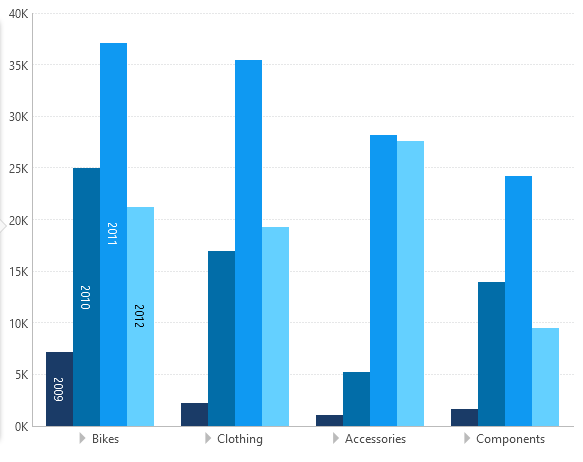
As an extension of the above example, consider a second hierarchy OrderDate added to the metric set on the opposite axis from Rows, which is Columns (Series). This produces a separate data point series for each year in a bar chart.
Now when configuring the measure sorting you also need to choose which OrderDate (year) values to sort by under Opposite axis members.
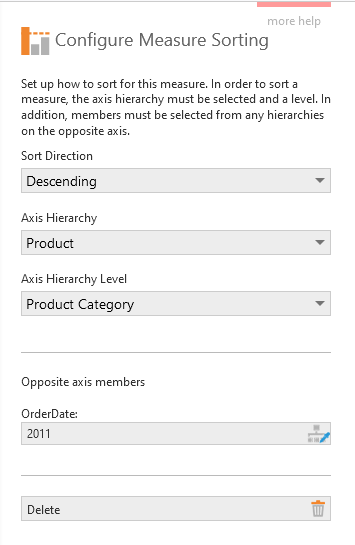
The resulting metric set shows measure values sorted in descending order for the selected year.