
1. Overview
This article shows you various ways a table visualization allows you to sort a metric set.
These capabilities are available both when working with a metric set checked out to you, and when viewing a table on a shared dashboard or other view (unless the sorting options were disabled).
2. Sort on multiple hierarchies
When you use a table visualization to display columns of text or dates (called hierarchies in Dundas BI) the columns in the table visualization can be formatted as either row header columns or regular flat columns.
Row header columns are always displayed on the left and indicate how the data is grouped, while flat columns can be displayed in any order regardless of the data grouping and have more customization property options. The default styling for row header cells in Dundas BI may include a grey background whereas regular column cells may use alternating lighter background colors - see the table elements diagram.
2.1. Row header columns
In the case of row header columns, the sorting priority is determined by the left-to-right order of the columns. This is the same as the order of the hierarchies found under Rows in the Data Analysis Panel for the underlying metric set, and this determines their grouping order.
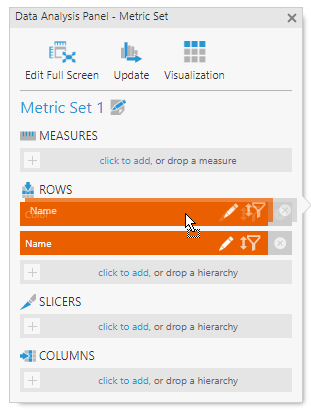
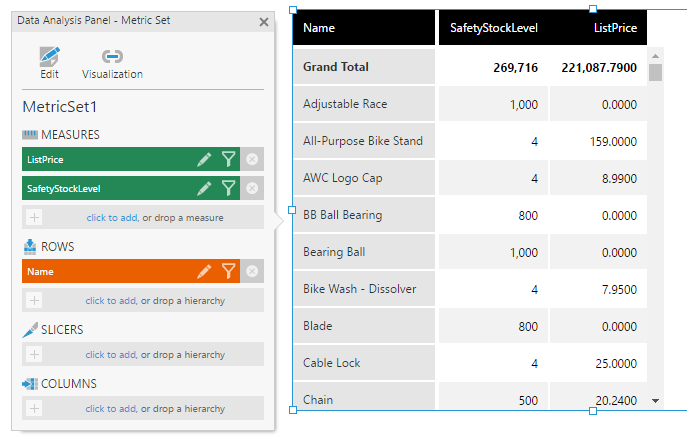
As an example, create a new metric set with hierarchies under Rows in the Data Analysis Panel.
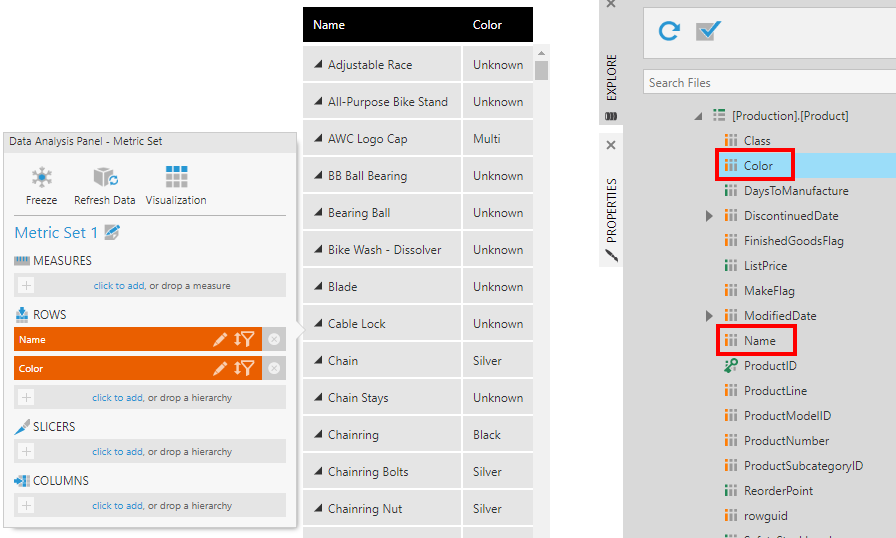
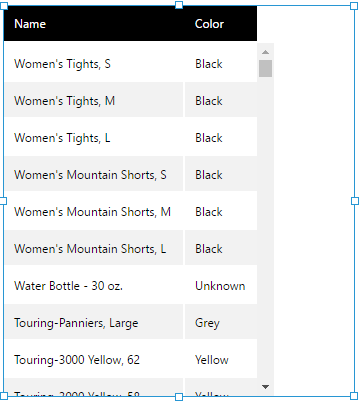
In the figure shown above, the data is grouped first by Name, the leftmost column, but each product name has only one color.
Reorder the table columns by dragging the header of the second column onto the header of the first column. (If your metric set is on a dashboard, switch to View mode first.)
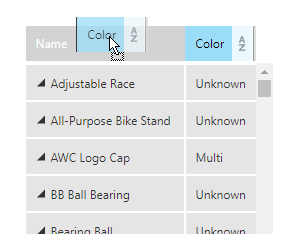
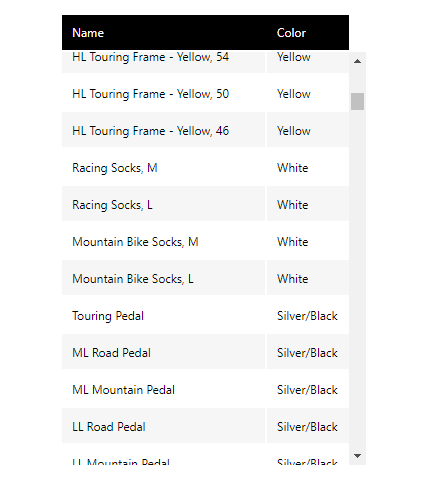
The columns, as well as the grouping of the hierarchy values, are now swapped. In this example, the data is now grouped first by Color, then by Name.
Hover over the first column header. Click the A-Z icon on the right to open the Sort & Filter popup.
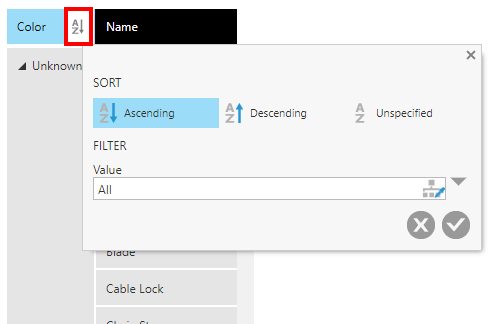
In the popup, click Descending to sort the first column in descending order. Do the same for the second column.
You will see the values in the first column are now sorted in descending order. In the second column, the values are also sorted in descending order within each color grouping.
Another way to re-order the columns is via the Data Analysis Panel. For example, drag the Name column over the Color column to switch them back.
You will see the Name column is now first again, with the values still sorted in descending order.
2.2. Regular columns
Regular 'flat' columns can also be reordered by dragging column headers in View mode, which is only a visualization choice that does not affect the data or how it's grouped. However, using the Sort & Filter popup to sort a regular column displaying text or date values will give that column the highest sorting priority without changing the order of the columns in the displayed table.
As an example, start with the metric set from the previous example with two hierarchies.
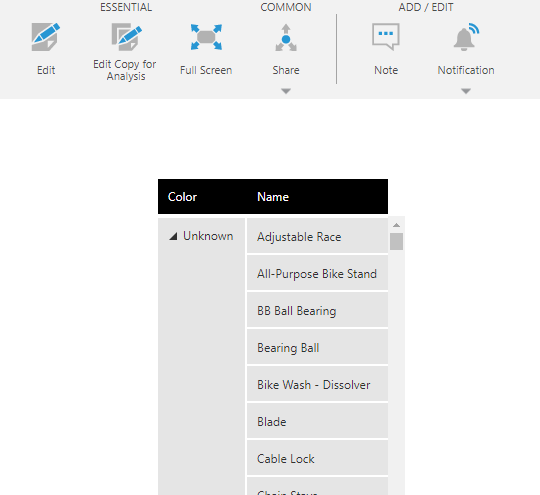
Select the table if on a dashboard, then click Re-Visualize and then Display As Flat Table in the toolbar (or directly in the toolbar in earlier versions). The data is now displayed as regular columns instead of row headers.
Switch to View mode if using a dashboard, then hover over the header of the second column. Click the A-Z icon to open the Sort & Filter popup.

Click on Descending (even if previously selected). Because this is now your last sorting action, the second column now has the highest sorting priority and its values are all sorted in descending order.
Because these are regular columns, the column order doesn't change in the visualization, but this hierarchy is reordered to be first under Rows in the Data Analysis Panel for the underlying metric set in order to provide the expected results.
3. Sort on multiple measures
Sorting multiple numeric columns is similar to sorting multiple row hierarchies displayed as regular columns, as shown in the previous section.
Measure columns can be reordered by dragging column headers as usual. This will not affect the ordering of the measures in the underlying metric set, and vice versa, as it is a visualization choice. Using the Sort & Filter popup to sort a measure column will give that column the highest sorting priority and cause the corresponding measure to be reordered first in the metric set, without changing the order of any columns in the displayed table.
As an example, create the following table using the Name, SafetyStockLevel, and ListPrice columns from [Production].[Product].
Switch to View mode if using a dashboard, and use the column header's sort & filter popup to sort ListPrice in Descending order. Then sort SafetyStockLevel in Ascending order.
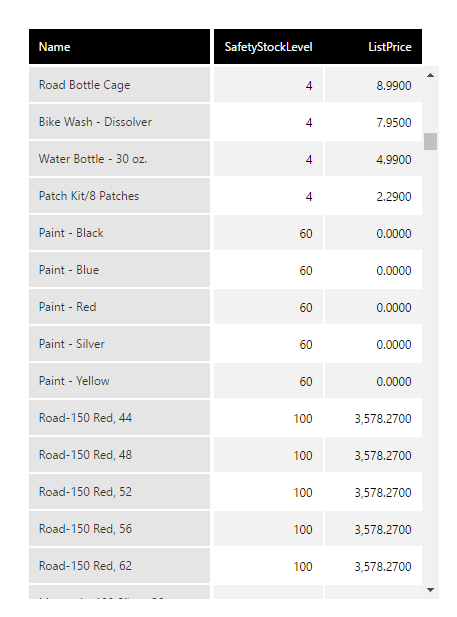
Observe that the SafetyStockLevel measure values are all in ascending order and the corresponding column has the highest sorting priority because it was sorted most recently. The ListPrice measure column has the next highest priority and its values are still sorted in descending order but only within rows with the same SafetyStockLevel value.
4. Sort on a measure and a hierarchy
You can mix and match sorting on hierarchies (text or date values) and measures (numbers). When you sort by a measure's values, the grouping between the hierarchies is maintained by default but you have options to change it.
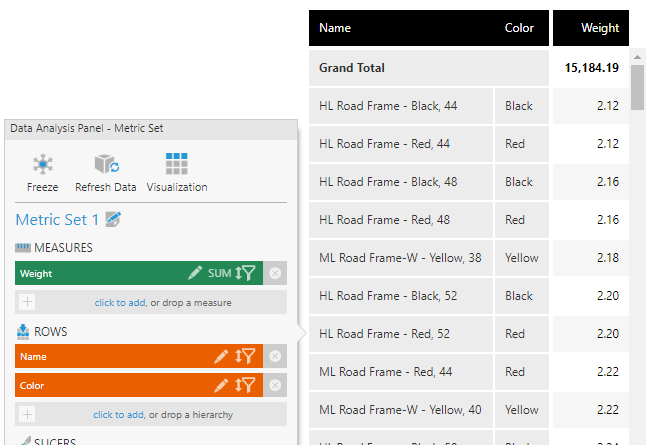
As an example, create the following table using the Color, Name, and Weight columns from [Production].[Product].
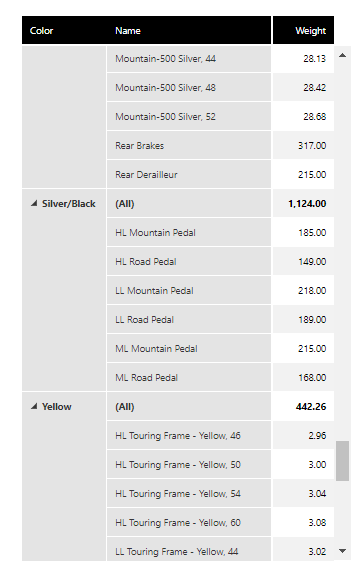
By default, the Color and Name columns are sorted in ascending order, while the Weight column does not have sorting applied.
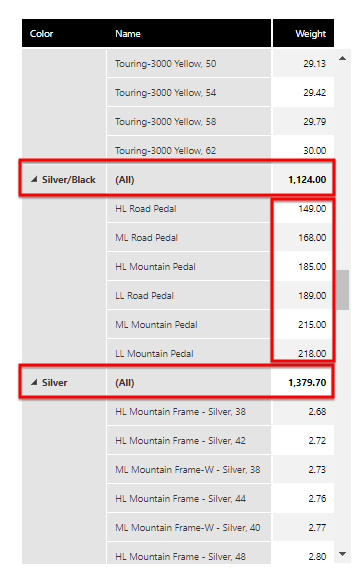
In View mode, change the sort on the Weight column to Ascending. You will see that the groups (the Color column) have been reordered based on their totals, and the rows in each group (the Name column) have been reordered based on their individual values.
Open the Sort & Filter popup for the Weight column again. You can change the hierarchy column responsible for how the data is grouped by selecting another hierarchy from the Grouped first by drop-down.
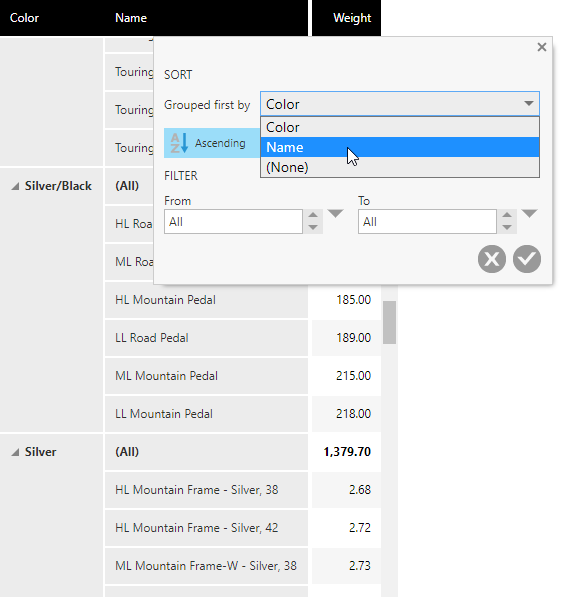
Changing this grouping option is the same as dragging to reorder the row header columns as shown in Section 2.1.
In this example, the Name column contains a unique name in every row, so the rows are now sorted in ascending order by weight independently without any effective groupings.
In Dundas BI 10 and higher, you can also choose the option (None) from the dropdown. This is similar to choosing a hierarchy with unique values such as Name in this example, but you may not have such a column. All rows will be sorted independently including any total rows, so the table's total styles will not be displayed in the sorted direction.
5. Sort using the context menu
You can apply sorting from the context menu when you right-click on a table cell. This option gives you the flexibility of applying sorting to just the rows of a particular hierarchy or level instead of all rows. When the column is sorted, an icon will indicate the direction of the sorting when you move the mouse over the table column header.
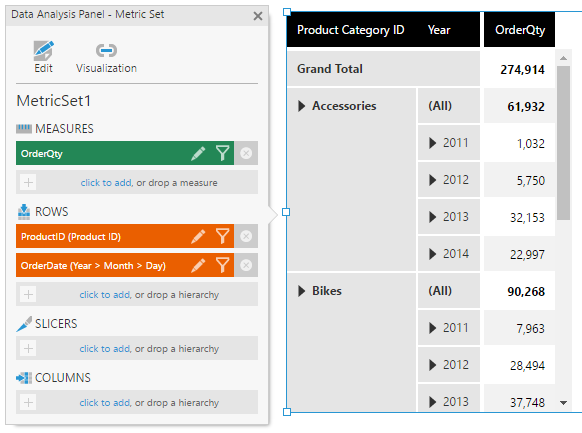
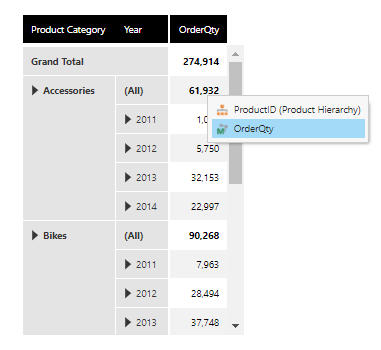
As an example, set up a table visualization with a product hierarchy, a date hierarchy, and one measure.
Switch to View mode and then right-click over one of the measure subtotal cells for a product category. From the context menu, click Sort.
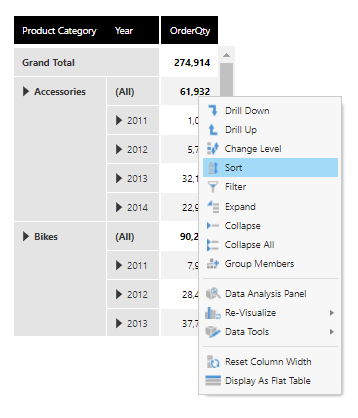
A sub-menu appears and asks you to choose the specific measure or hierarchy to sort on. Click the measure (OrderQty).
Click Descending.
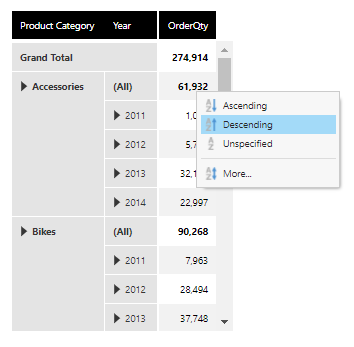
The product categories are now sorted in descending order according to their corresponding subtotal measure values. The date rows within each product category are unchanged.

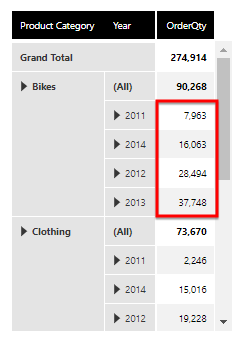
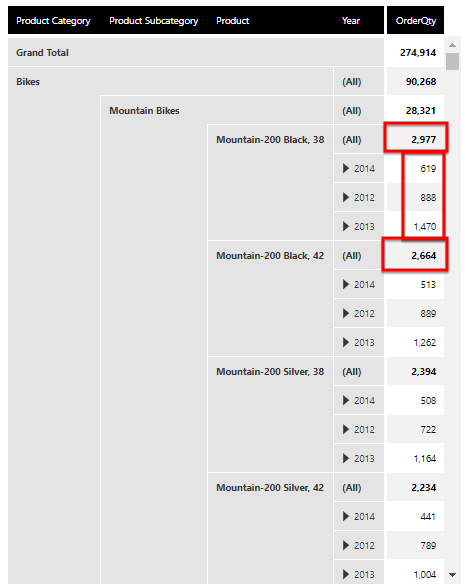
Next, right-click on a measure cell corresponding to one of the date rows.
Click Sort, select OrderQty, and then click Ascending.
Date rows within the product category are now sorted in ascending order according to their measure values. The product categories are still in order by descending measure value.
5.1. Multi-leveled hierarchy
If there are multiple levels in a hierarchy, you can define sorting for each displayed level using the context menu. These settings will be saved even if you change the displayed hierarchy level: the sorting you previously set for a level will take effect when measure values for that level are displayed again.
Different levels in the hierarchy affect the sorting in a similar way to having multiple hierarchies, because data is grouped by the values in each displayed level. As a viewer, you can change the displayed levels using the context menu.
In the previous example, while in View mode, right-click the visualization and select Change Level.
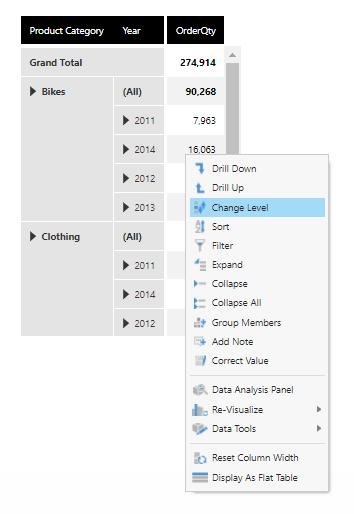
Select the ProductID hierarchy and select the Product level.
Right-click the visualization again and select Change Level.
Select the ProductID hierarchy and select Change Top Level.
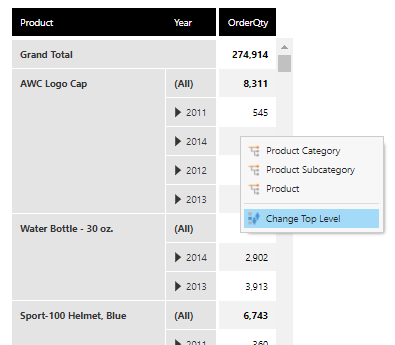
Select the Product Category level.
While products are still in descending order by OrderQty, and years are in ascending order by OrderQty within each product, the sorting has been affected because the products are now first grouped within their subcategories, and subcategories are grouped within their category. This is the result of choosing to display these upper hierarchy levels.
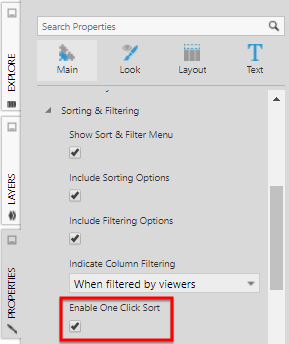
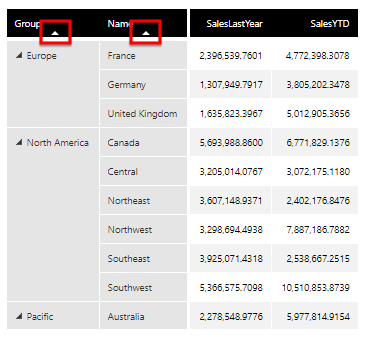
6. Sort with one click
Hierarchy headers also support one-click sorting, which allows users to simply click the header to sort the rows in ascending, descending, or unspecified order. A triangle icon above the header text tells you which direction it is currently sorted. If you do not see the icon, it means the sort direction is unspecified.
To use this option, open the Properties panel for the table and check the Enable One Click Sort property.
7. Notes
- Some sorting features are not available when using a Dynamic Hierarchy and editing the metric set full-screen, but you can use them when viewing a dashboard that uses this metric set.