1. Overview
This article shows you how you can handle null values and missing data in your metric set. If rows are missing from your data or have measure values that are null or missing, you can set up a missing data rule to display them and optionally fill in their measure values.
By default, measure values that are null or missing are not displayed by the metric set or its visualizations.
2. Example data
2.1. Missing measure values
This first example uses the Sales.SalesPerson table from the AdventureWorks sample database, which contains rows where the SalesQuota column is null (missing).
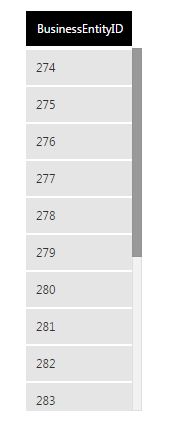
First, drop the BusinessEntityID column onto a metric set or dashboard:
Then, drop SalesQuota onto the area over the table visualization labeled Column:
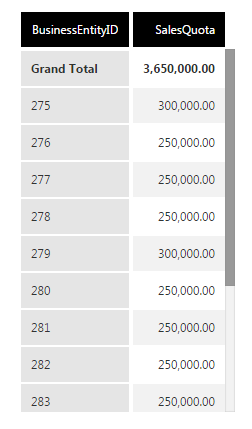
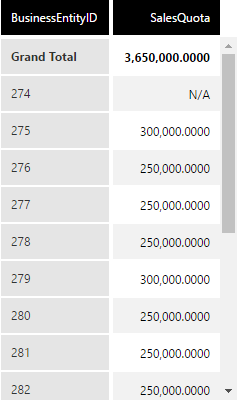
Notice that BusinessEntityID 274 is now missing in the list after the SalesQuota was added. This is because there is no SalesQuota value in that row, but you can display it using a missing data rule.
2.2. Missing dates or hierarchy values
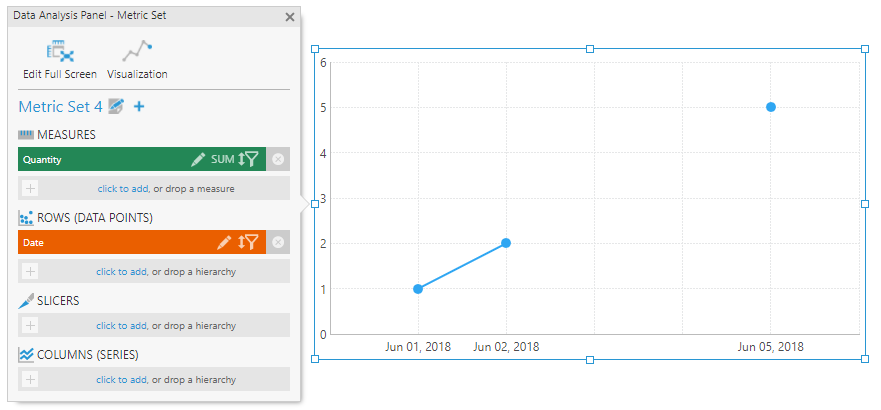
As another example, the following data source is missing entire rows corresponding with June 3rd & 4th, and contains rows only for the 1st, 2nd, and 5th:
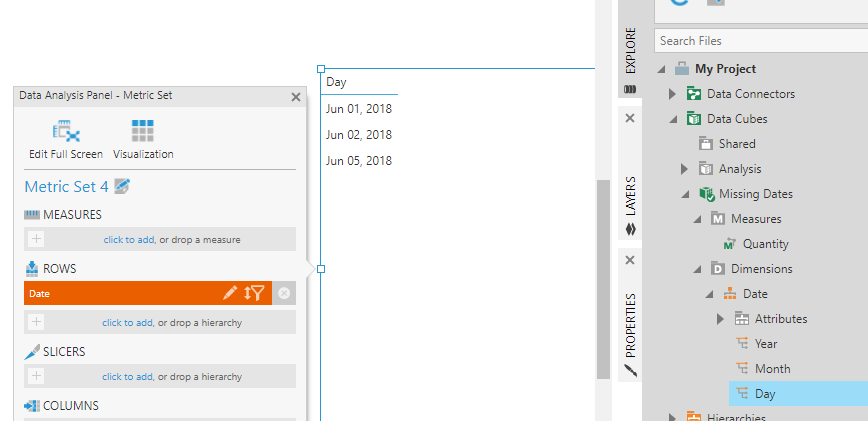
This column of dates was promoted to a time dimension hierarchy in a data cube ahead of time, and its Day level was dragged onto the canvas to create a metric set. When working with a column of dates directly from a data connector, you can expand it to drag a time dimension hierarchy level without leaving your metric set or dashboard.
A time dimension is able to add in entire rows of data for dates that are missing from your data source according to the current level of the hierarchy, such as Day, Month, Hour, etc. Similarly, a predefined hierarchy can fill in entire rows missing for other types of values.
After adding a measure to the Data Analysis Panel, the data is automatically visualized as a line chart showing gaps for the missing dates. In this example, markers were also enabled to clearly show each data point along the line:
3. Using a missing data rule
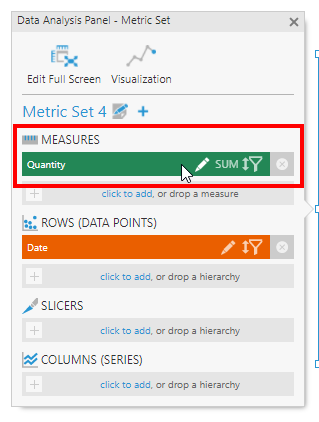
To include the missing rows or measure values, click to edit the measure in the Data Analysis Panel.
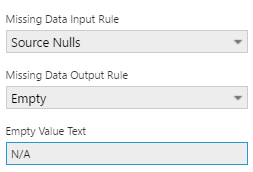
In the dialog under Element Settings, set the Missing Data Input Rule to determine which missing data to include:
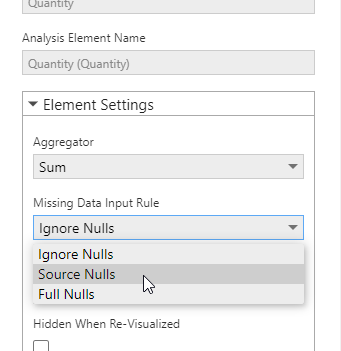
- Ignore Nulls (default) – does not include any measure values that were null or missing.
- Source Nulls – includes only the null measure values present in the records in the data source.
- Full Nulls – includes all possible null values even if records did not exist for them in the data source.
If we choose Source Nulls for our first example, BusinessEntityID 274 can be displayed. When using a time dimension or predefined hierarchy like in the second example, the Full Nulls option can fill in missing hierarchy values.
Next, set the Missing Data Output Rule to determine how missing measure values should be displayed:
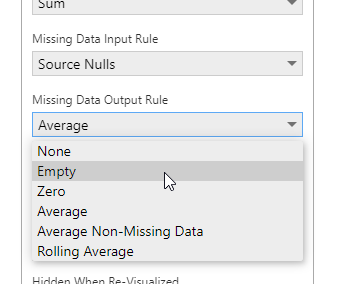
- None (default) – does not display data where the measure value was null or missing, and excludes those rows or columns.
- Empty – a row, column, or data point is included but the measure value is left null/blank.
- Zero – inserts zeros where the measure value was missing.
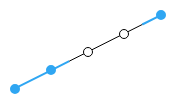
- Average – displays the average between the previous and next data points.
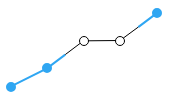
Averaging between each point - Average Non-Missing Data – displays the average between the previous and next data points that were not missing measure values.
Average of non-missing data - Rolling Average – displays the average of a certain number of previous data points determined by the Rolling Average Period setting.
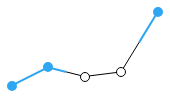
Rolling average of previous two
For the options that calculate an average, also set Axis The Average Will Affect. This is typically Rows to use next and previous rows in a table or data points in a series, but can be Columns.
If you choose Empty, the Empty Value Text field will allow you to optionally insert text to be displayed in place of the measure value (e.g., N/A).
In our first example, BusinessEntityID 274 can now show N/A for SalesQuota.
4. Styling missing data
You can style cells or data points differently for missing data using the Properties window.
4.1. Table
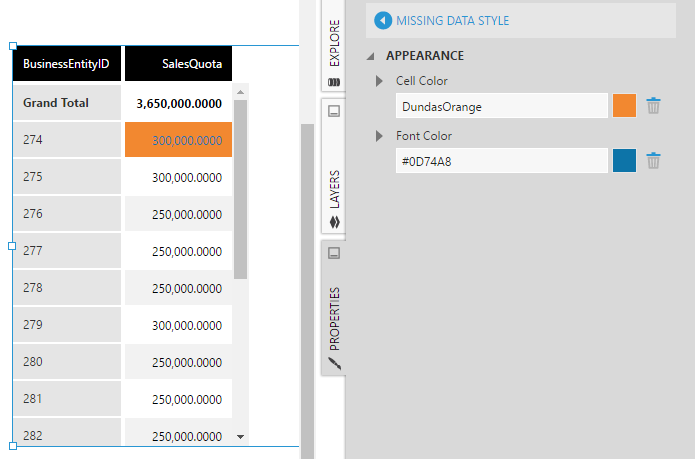
In the Design tab of the properties for a table, expand Header, Row & Cell Styles and select Cells. (In previous versions, go to the Look tab and click Missing Data Style.)
Missing Data Color under Font & Text and Missing Data Background under Lines & Fills can be set to distinguish cells showing data calculated by the missing data rule.
4.2. Chart
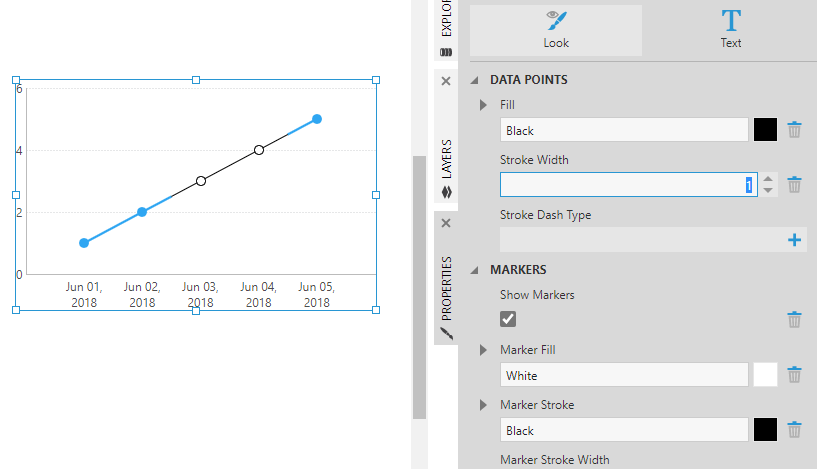
In a chart, go to the properties for its data point series. You can right-click a chart's data points when editing and choose Series Properties.
Expand Lines & Fills and click to edit the Missing Data Style settings (previously in the Look tab). In this example, data points calculated by a missing data rule are distinguished using a thin black line stroke and white markers: