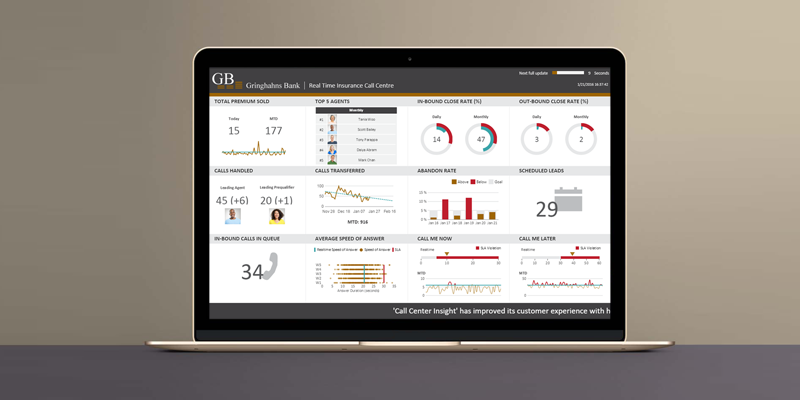
Dashboards provide a central location for users to access, interact and analyze up-to-date information so they can make smarter, data-driven decisions. Good dashboard software enables you to monitor and measure performance and metrics in real-time and on the go. You can visualize and analyze data and focus on Key Performance Indicators (KPIs) from across the organization on a dashboard, helping you gain valuable insight and drive quick and accurate decision making.
With Dundas BI you get a consolidated view of all your data from across your organization on custom dashboards so you can gain valuable insight into your entire business the way you want it. From there, you can immediately act or further visualize and analyze any data to answer new questions and make real-time data-driven decisions.
Increase Efficiencies with Faster Access to Business Intelligence
With Dundas BI your data is quickly accessible and actionable. Our interactive dashboards let you monitor and measure performance and metrics in real-time. With quick self-service access you can modify existing dashboards or create new ones using other metric sets. You can easily customize dashboards and reports to get your business intelligence faster without waiting for IT’s help.
Whether you are providing reporting and analysis for an entire organization or line of business, Dundas BI allows organizations to go beyond their initial dashboards and continue to explore their data and find new insights via data discovery and visual data analytics.
Better Decision Making
You can analyze key data more quickly and thoroughly, improving the performance in each functional department when utilizing a well-designed dashboard. Our dashboard software provides rich interactive visualizations, making the analysis process more intuitive and performance issues easier to observe. Visualization interactivity allows you to go deeper and find more answers, serving as an effective solution to the overwhelming amount of data that business users experience every day. With built-in data animations, Dundas BI can improve data discovery and help users better and more easily identify the true impact of their data.

Improve Focus and Alignment to Gain Competitive Advantage
A full view of your organization’s data allows your team to focus on the most important KPIs and align business processes with your goals. Dundas BI lets you create dashboards that drive behavior and actually improves the work habits of those viewing it. You can easily connect and access your data with the same experience and capabilities across all data sources (e.g. Big Data, OLAP, operational databases and data files), reducing the learning curve when it comes to analyzing new data. Use Dundas BI to visualize and analyze a consolidated view of your information and actionable data needed to increase your competitive advantage.
Flexibility for Business Growth
An effective Dashboard is continuously iterated upon as your business grows and changes.
With Dundas BI, all common BI needs to support your changing business needs are under one platform, including data connectivity, data preparation, presentation, self-service analytics and administration.
Our BI and dashboard software is designed with customization, extensibility and ease of integration in mind. The ability to adapt to your systems and work flows is key to ensure greater adoption and impact on more users. With an open and flexible platform, Dundas BI supports many levels of customizations from simple end user configurations to CSS styling and full scripting. Full API support and extended scripting allows you to easily integrate and embed into existing systems, applications and administration.
As Dundas BI is a server-based technology, it requires very little work to install, manage, extend and upgrade. It is enterprise-ready with the advanced security, governance and scalability needed for large scale deployments. In addition, the full administration and simplified management tools in Dundas BI allow for ease of IT administration decreasing the maintenance involved.
Be Mobile – Take Your Business Intelligence with You
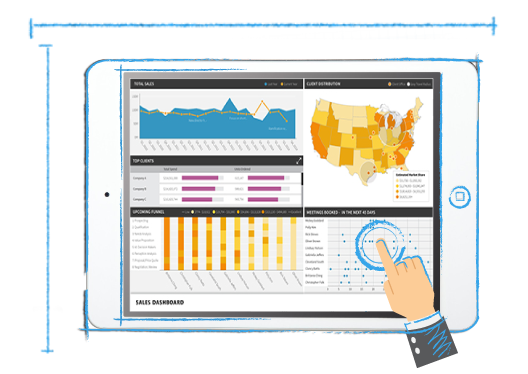
Today, users expect more functionality on their mobile devices. They want to have complete interactivity with their dashboards and reports while on the go, they don’t want to be limited to just view an image of it. Dundas BI provides organizations with a single application for connecting, interacting, analyzing and visualizing any data, from virtually any data source, on any device.
Dundas BI was designed for mobile with HTML5 web technology letting you view, analyze and interact with any data, on any device - all in real-time. Our touch friendly experience for quick data discovery enables consumption and analysis of data wherever you are.

Enhance Collaboration & Communication
Collaborating with your colleagues and sharing KPIs and critical insights is critical to making smart business decisions and making sure everyone in the organization is working towards the same goals. Dundas BI encourages collaboration and offers real-time tools to keep everyone on top of the latest data – effortlessly.
With easy to use, intuitive, built-in tools, such as notes, notifications, slideshows and scheduled reports, you have the power to interact with, monitor and share key business metrics with your team — with minimal assistance from IT. And with a uniform design and viewing experience, you can utilize the same tools and options across any data source and on all devices.
Dundas BI helps you gain insight into your entire business by providing a consolidated view of your information and actionable data. You can visualize and analyze any of your data, on any device, so you can have everyone make real-time data driven decisions that produce results.
Contact us today to learn more about Dundas BI and our dashboard software – info@dundas.com
Free Online Trial or Full Product Download Available - http://www.dundas.com/support/dundas-bi-free-trial
Follow Us
Support