
1. Overview
You can share and export a dashboard, report, or other view: share as a link to send or save, or export it to file formats such as CSV, Excel, an image, PDF, or PowerPoint.
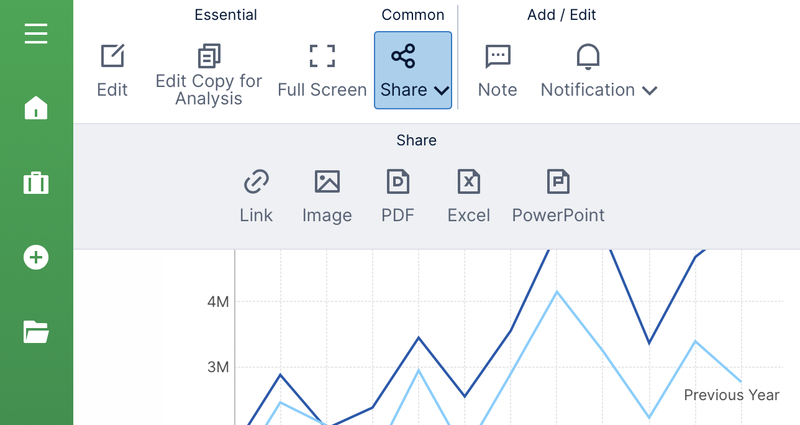
When viewing or editing the view you want to share, find the Share option in the toolbar if displayed. You can also right-click or long-tap an empty part of the view to find it in the context menu.
Related video: Sharing and Exporting
2. Share options
2.1. Link (URL)
The Link option gives you a URL for viewing your current dashboard, report, or other view. You can bookmark it in your browser, or send it to someone else. Changes you've made while viewing such as filtering and sorting will also be included in this link (also known as a 'short link').
In the Share dialog, the Link field holds the web address or URL. If you click the copy button next to it and paste the link elsewhere, you can then close the dialog if not using the remaining options.
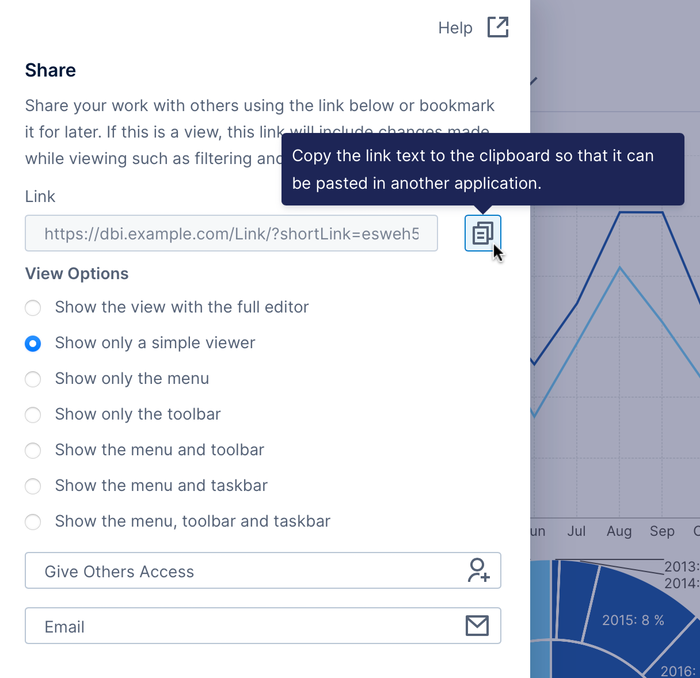
Under View Options, an option is selected initially so that the view is opened by itself full-screen, without the menu, toolbar, or taskbar (they may still be available from the right-click context menu). Choose a different option if preferred.
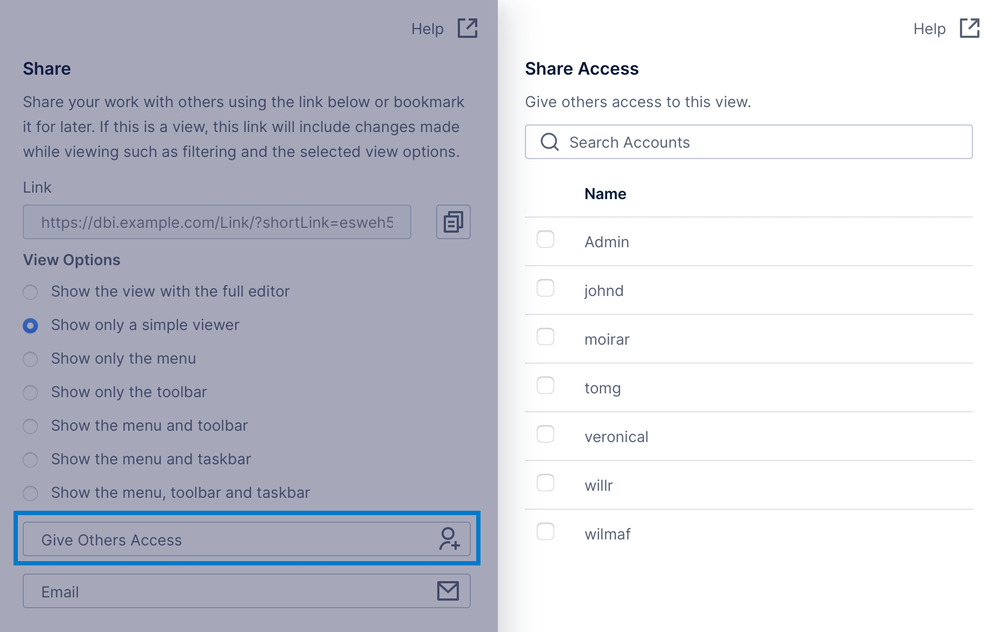
If people you're sharing with don't already have access to this view, and you created it or have the Full Control privilege for it, click Give others access and select them. For example, files you create in My Project are only accessible to you by default.
2.2. Image
The Image option uses the PNG format and lets you export the entire view, such as a dashboard or scorecard, or you can select a specific visualization.
The Export dialog will open with the Format set to Image.
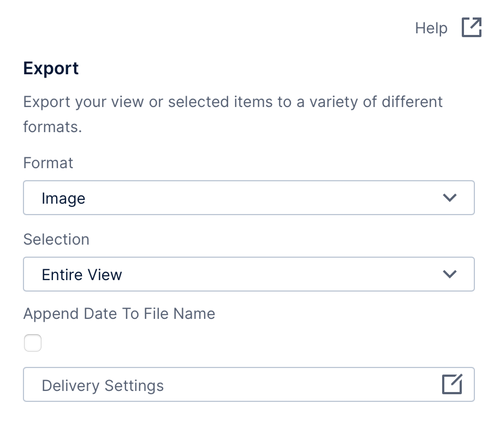
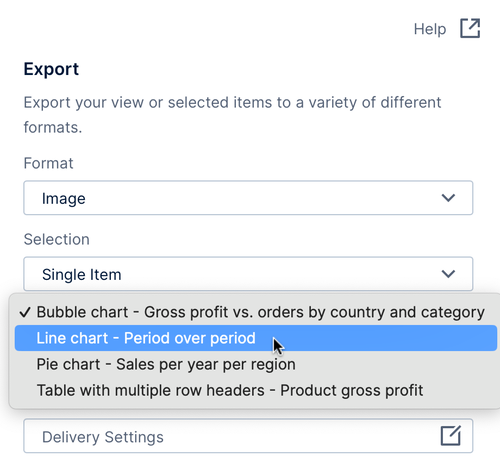
The initial settings export the entire view to an image. For dashboards, you can export a specific visualization by setting Selection to Single Item and then choosing the visualization from the next dropdown list.
The view will be exported as you currently see it, taking into account content that can be shown and hidden, for example. Reports export a ZIP file containing an image for each page, and slideshows do the same for each slide.
2.3. Excel
You can export the all the view's data or data from selected visualizations (including those in embedded views) to the Microsoft Excel format (XLSX) by choosing the Excel share option.
The initial settings export data from all visualizations, with each one in its own sheet or tab. In reports, scorecards, and small multiples, there may be multiple visualizations such as data labels sharing data from a single metric set, which will be combined together in one sheet.
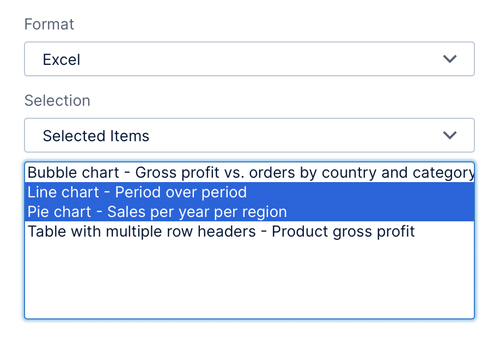
For some view types, the Export dialog has a Selection option you can change: the All Visible option takes into account visualizations that can be shown and hidden while viewing, or choose Selected Items and click to select one or more individual visualizations to export their data, using the Ctrl, ⌘, or Shift keys on your keyboard to select multiple.
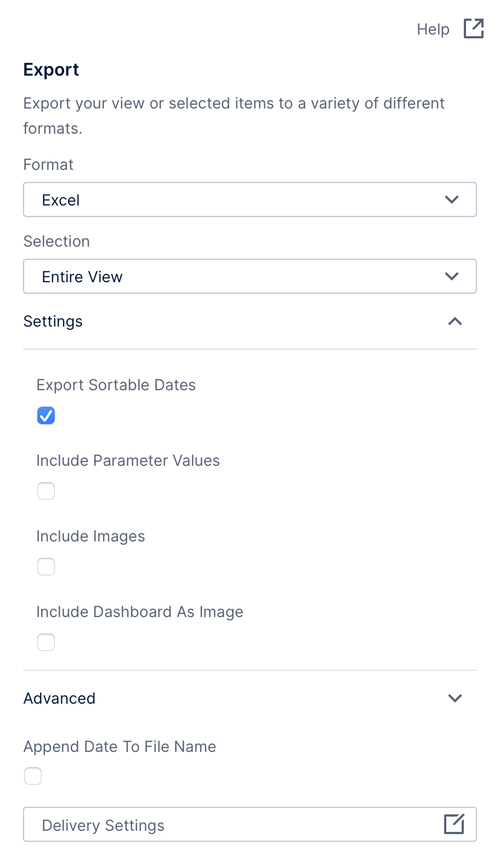
Under Settings, if you do not want to sort date and time columns in the exported Excel file and want to ensure the display format remains the same, clear the Sortable Dates checkbox.
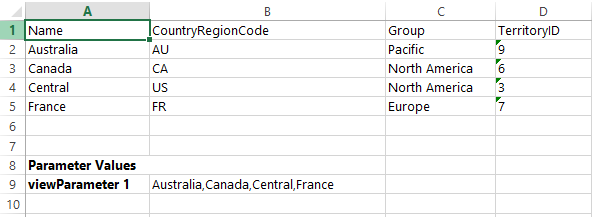
Select Include Parameter Values if you want filter/parameter settings included in the resulting Excel file.
Optionally, select the Include Images checkbox if you want an image of each visualization to be added to the resulting Excel file, or Include Dashboard As Image for an image of the entire dashboard on a separate sheet.
By default, the resulting Excel file will include various customizations and styling applied to text cells in dashboard table visualizations and, in version 25.3 and higher, to a report's text via its labels, headers, data labels, and template cells combined in a separate sheet. This includes font and background colors including state styles and color rules, visual column ordering, custom header text, etc. For dashboard charts, only the data set up to be visualized will be exported by default. To exclude this visual formatting and export the data directly, expand the Advanced section and select the Exclude Styles option. Image columns from a table can be included if possible by enabling Add Data Images To File.
2.4. CSV
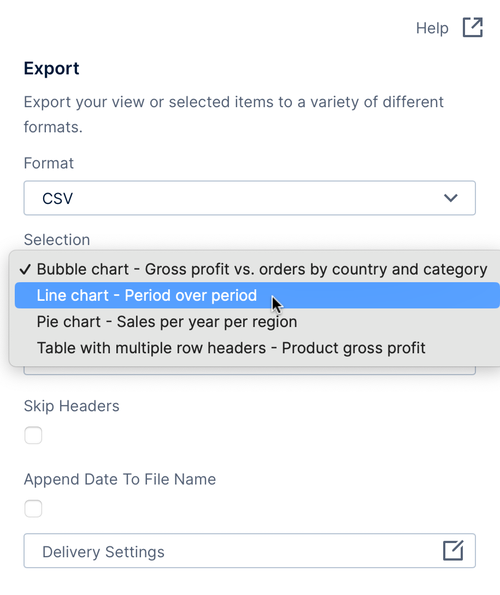
To export to a comma-separated values (CSV) file, first choose the Excel share option, then change the Format setting to CSV.
- You can enter a custom Delimiter character to use instead of a comma (enter \t for tab). The exported filename extension can be customized by an administrator in configuration settings.
- Only a single visualization can be chosen for export from the Selection dropdown, or choose a report or scorecard group to export all of its header, row, and footer text together. For reports, scorecards, or small multiples, selecting a visualization may export the combined data result shared between multiple visualizations, as with Excel exports.
2.5. PDF
The PDF option can be useful for sharing, saving for offline reading, or for printing. Reports are also specially designed to be exported to PDF and can include page headers and footers.
In the Export dialog, you can change page options such as the Paper Size, page Orientation, and optional Password protection:
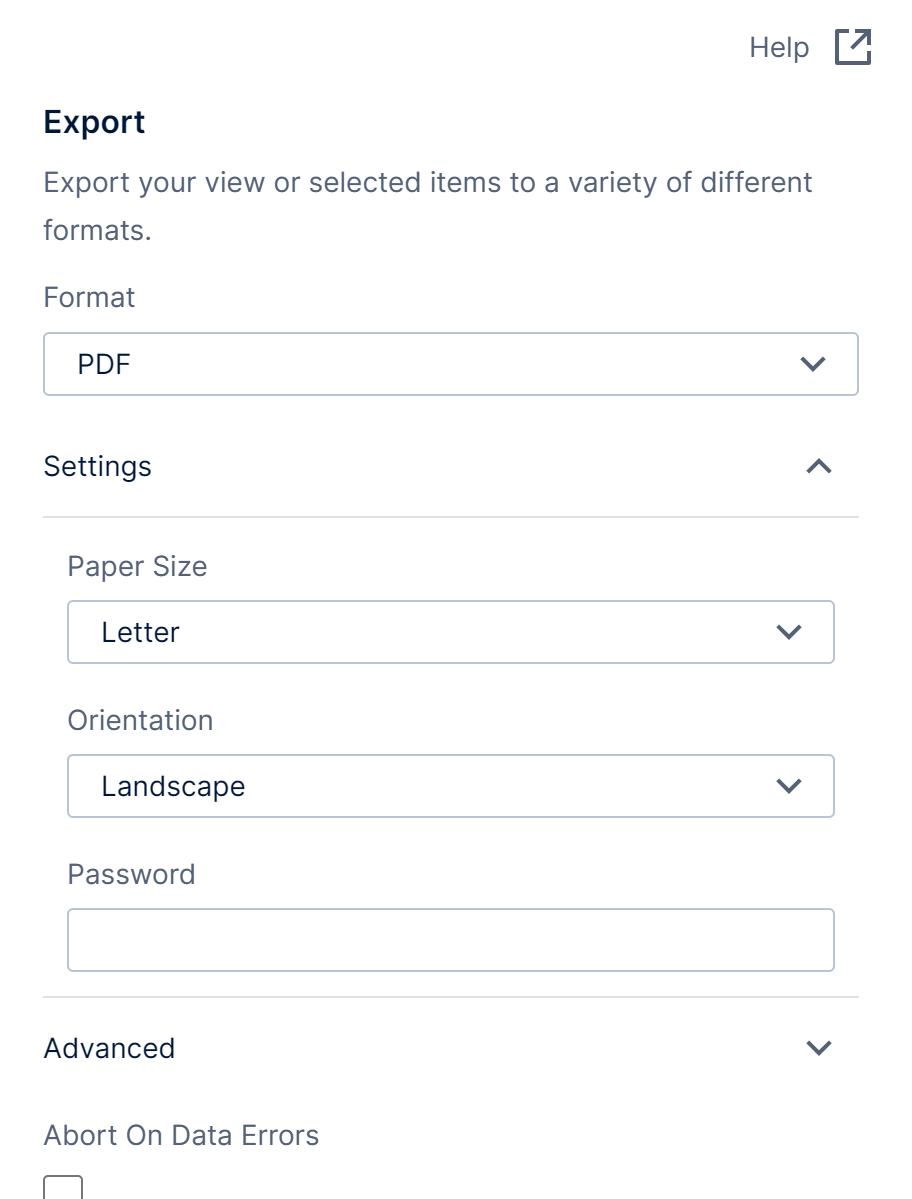
The view will be exported as you currently see it, taking into account content that can be shown and hidden, for example. Dashboards designed in Responsive mode will be exported in Scale mode to better fit the selected page size.
2.6. PowerPoint
The PowerPoint option exports the current view as one or more image slides in a PowerPoint file (PPTX). You can present this file, or copy or combine its slides with others.
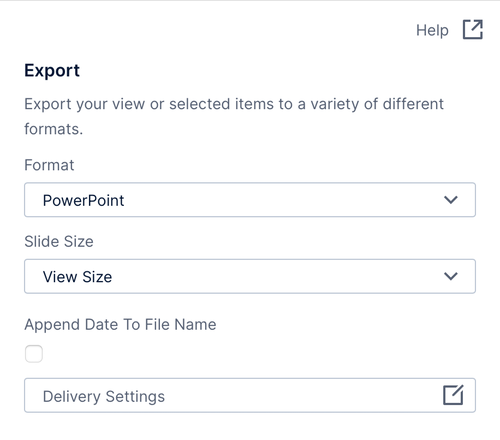
Most types of views export a single slide, while a report exports a separate slide for each of its pages, and a slideshow exports a slide for each of its own slides.
The slide size in the resulting file is based on the size of the view you are exporting by default, but this can be changed using the Slide Size setting.
3. Downloading exported files
To export to a file immediately from the Export dialog, click Export at the bottom of the dialog to begin the export process. Once it finishes, click the Download the created export button that appears.
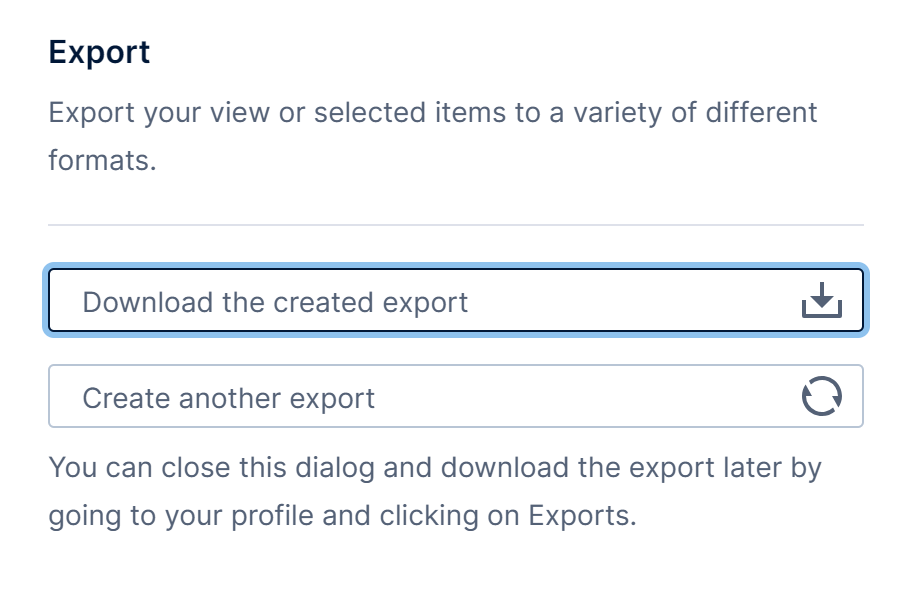
You can click the Close button before the export completes, for example when waiting for a long report to export. From your profile, you can then manage the export process or download the file once it finishes, as well as download other recent exports from the last 7 days or the length of time set by your administrator (using the Export Result File Lifetime configuration setting).
If you want to customize the filename, options are available before clicking the Export button, with descriptions displayed when hovering over them with your mouse. For example:
- The name of the downloaded file can optionally include the current date if you select the Add Date To File Name checkbox option. You can then optionally enter your own Custom Date Format using the same syntax used elsewhere in the application such as when formatting a time dimension, otherwise the default format is used (customizable by an administrator using the File Name Date Time Format configuration setting).
- You can enter your own Custom Filename (leave out the file extension, which will be added automatically). If you also selected the options to add the date to the filename with a custom placement, enter $Timestamp$ into your custom filename as a placeholder.
4. Delivery settings
You can optionally share your link or exported file directly via e-mail or another available delivery method. This is similar to a notification but sends the link or file just once on-demand.
Click the Email or Delivery settings button, then choose your recipients and set a message, or set other options – for details, see the similar delivery settings for notifications.
Click the Save button when finished with the delivery options, then click the Save or Export button in the first dialog to share or export via your selected delivery settings.
5. Options when editing
When editing a view such as a dashboard, there are options available to determine what's exported when it's viewed by others.
5.1. Prevent data export
If you do not want viewers to be able to export certain data to Excel or CSV formats, there are options on each metric set and each of its elements. (These do not affect exporting to image, PDF or PowerPoint.)
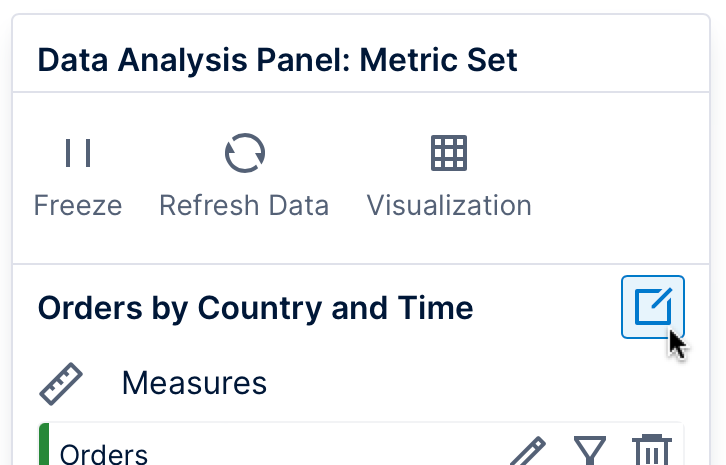
To prevent the data export for the whole metric set, click the Edit icon in the Data Analysis Panel, then select the Prevent Data Export checkbox in the dialog that appears.
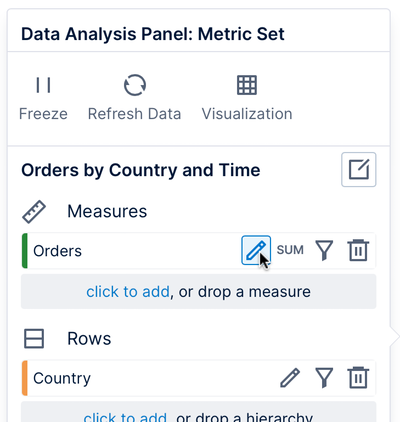
Similarly, you can prevent data export for each measure or hierarchy listed for the metric set. Click to edit the element from the Data Analysis Panel, then check the Exclude From Data Export checkbox
5.2. Export timeout
If you expect or find that a particular dashboard, report, or other view will take significantly longer to export to a file than is currently allowed, you can adjust its Export Timeout property.
When editing the view, open the Properties window with nothing selected (click an empty area if you have selected an element), and find this property in the Main tab. Set this in the hh:mm:ss format (where hh is hours, mm is minutes, and ss is seconds), or set to 00:00:00 to use the Export Render Timeout setting in administration.
5.3. The Before Export event
It's possible to add actions such as a Show/Hide action or script that will run only when a user exports to PDF, image or PowerPoint, without affecting general viewing. (Data export to Excel or CSV is not affected.)
To add one of these actions, open the Properties window with nothing selected on the canvas, and add an action to Before Export. For example, you might want to exclude certain content such as buttons when exporting: see the article Add a change layer action on ready event for details.
Or, the following script would change a dashboard's background color only when exporting:
this.background = new dundas.controls.SolidColorBrush(dundas.controls.Color.fromString("AliceBlue"));
If you write script that performs asynchronous operations such as a data retrieval call during this event, you should make the export process wait for it to finish before it produces its image:
e.isAsync = true;
//...
asynchronousMethod.done(function (result) {
  //...
  // resolve the deferred
  e.deferred.resolve();
});
6. Notes
Some additional general notes not included above:
- Legends and components such as labels are separate from visualizations like charts, but can be included in the image when selecting to export only a single visualization if they are placed within the boundaries of the visualization (including its Padding set in the Properties window).
- Exporting of images, PDFs, and PowerPoint is performed on the server where the software was installed, so only fonts that have been installed on that server or included via CSS or HTML can be used to render. If you specify a Font Family not available on the server, which may use a Linux operating system, a different font may be used than the one in your own browser. (The default font Inter in version 23.2 and higher and the font Source Sans Pro are included by default.)
- You can modify the Company and Creator that appear in exported Excel and PowerPoint files with the Company Meta Data Text and Creator Meta Data Text settings in the configuration settings in the Export category.