1. Overview
This walkthrough shows you how to add a period over period (or date offset) comparison.
Period over period lets you compare measure values for one period of time against the results from a previous or subsequent period of time, for example year-over-year.
Related video: Period over Period Analysis
2. Walkthrough
A period over period measure can be added to any metric set with a measure and a time dimension hierarchy.
This example starts with a new metric set.
2.1. Create a metric set
You can create a full screen metric set from the main menu by choosing Business and then Metric Set, then clicking Create. You can also follow the steps below when editing a metric set on a dashboard or other view.
Add a measure (numeric data) to Measures in the Data Analysis Panel, and also add a time dimension hierarchy. In the figure below visualizing as a bar chart, we expanded OrderDate under a data connector to find a time dimension hierarchy and dragged its Month level to Rows (Data Points). If you are using a data cube instead, it must have a time dimension hierarchy set up already in its Process Result for you to use.
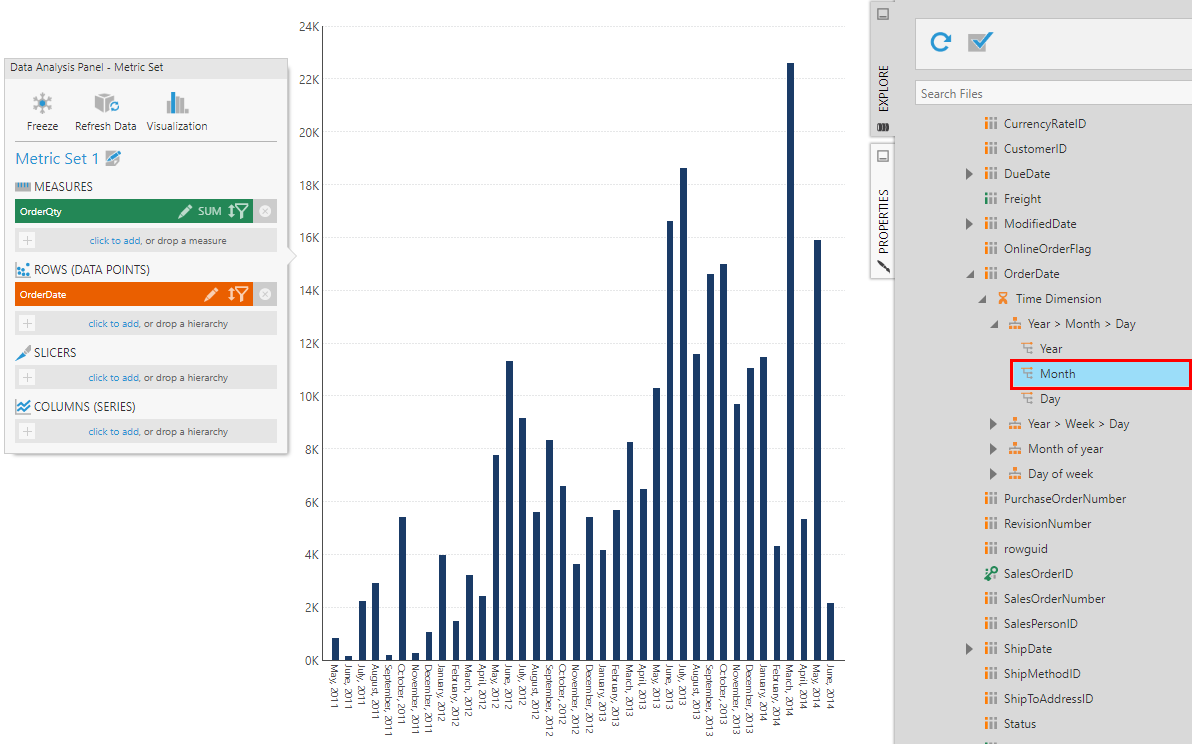
The time dimension hierarchy can also be selected on Slicers or Columns if you prefer.
There are built-in time dimensions ready for you to use, or you can create and/or customize one. For more information, see Create a time dimension.
2.2. Filter the dates
A period over period measure is most useful when comparing against a filtered range of dates.
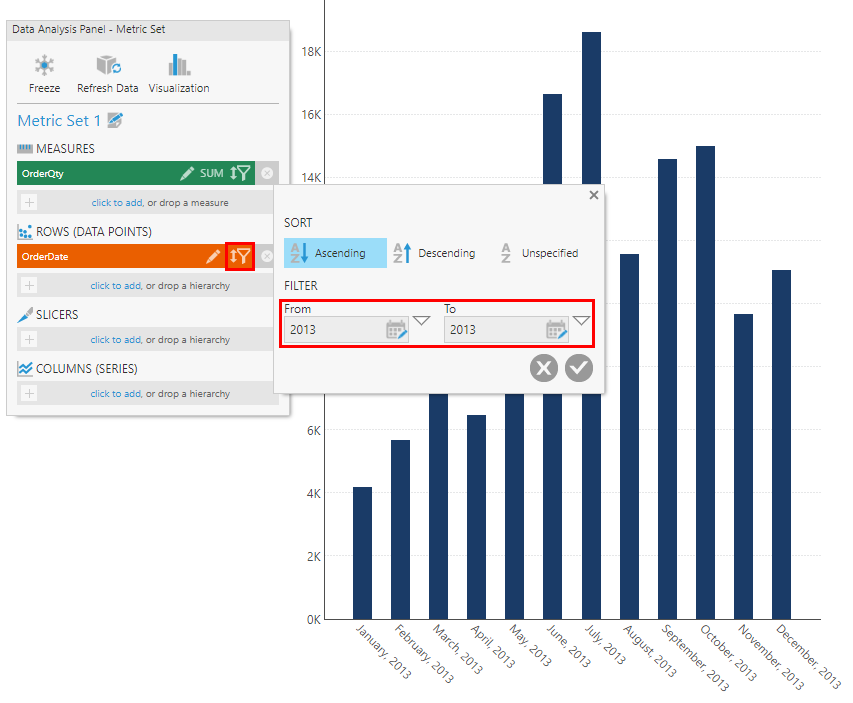
In our example, we will filter our time dimension to show a single year, which you can do from the filter icon in the Data Analysis Panel.
2.3. Add a period over period measure
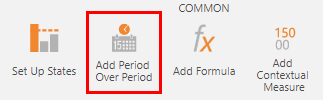
In the toolbar, click Add Period Over Period. When editing a dashboard or other view, you can find this option under Data Tools in the toolbar.
The Period Over Period Comparison dialog is displayed.
By default, the previous year's data is selected for comparison. Adjust these options if you prefer.
When editing a dashboard, there is a checkbox labeled Automatically Add Parameter Control. If selected, a Time Lag filter will be added allowing you to change these period over period settings while viewing the dashboard. You can also add this filter later to your dashboard or to other types of views like reports.
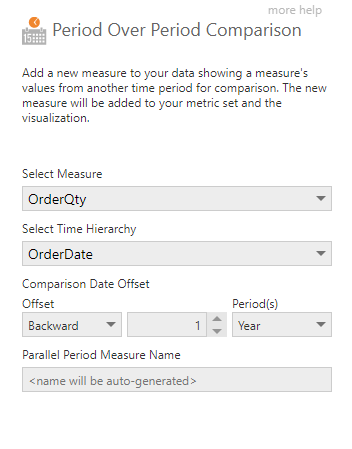
Click the submit button at the bottom of the dialog to update the metric set with a new measure displaying data from a different time period directly alongside the original.
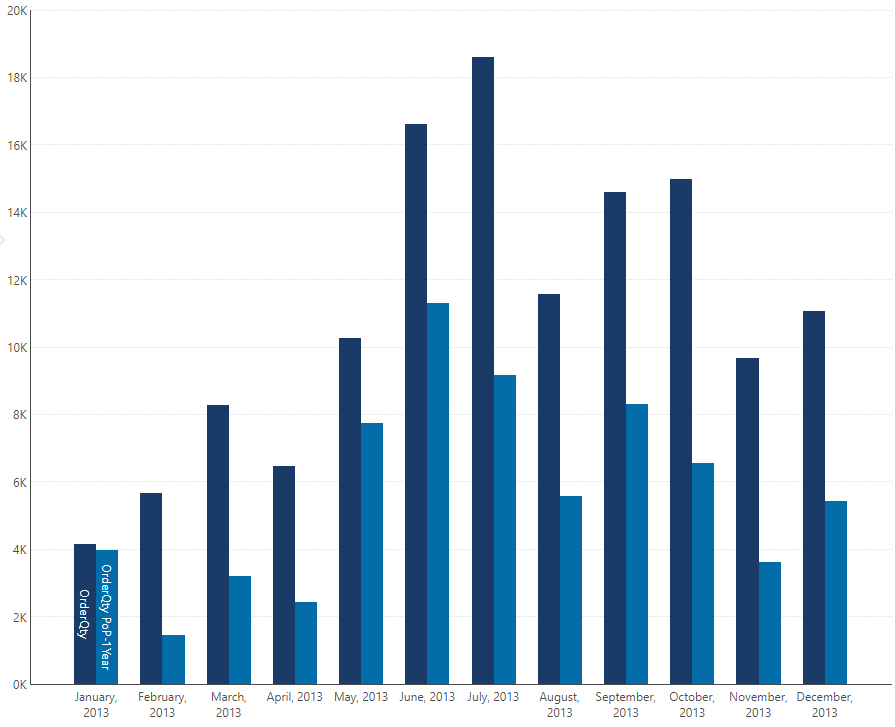
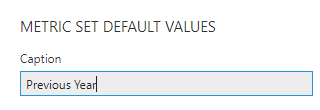
To rename the new measure, click to edit it in the Data Analysis Panel and change the Caption.
3. Returning all comparison data
A period over period measure normally only returns values for dates where there are corresponding values for the input measure (for example, OrderQty). However, there may be situations where you want to see all of the period over period measure values, regardless of whether there is anything to compare against. For example, you may want to see the period over period values extended into the future in order to determine sales goals.
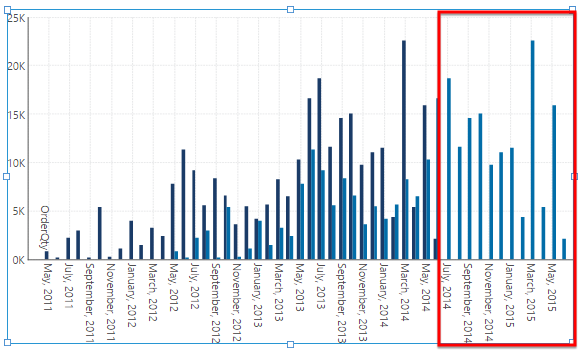
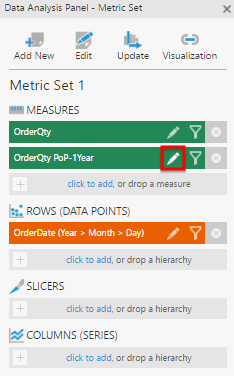
As an example, consider the same bar chart visualization of OrderQty and OrderQty PoP-1Year measures, but without the member filter applied.
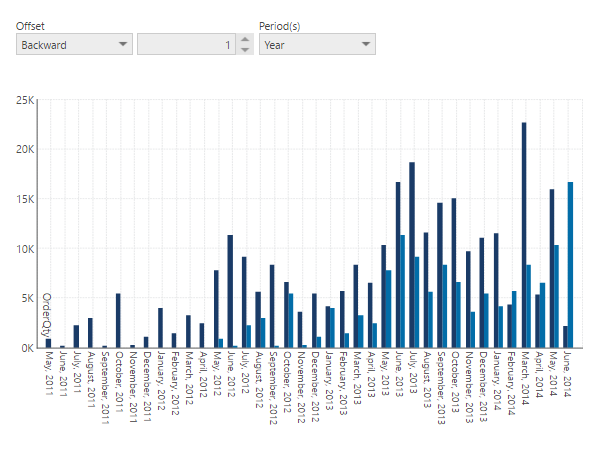
To have this chart show all of the period over period values, open the Data Analysis Panel and edit the OrderQty PoP-1Year measure.
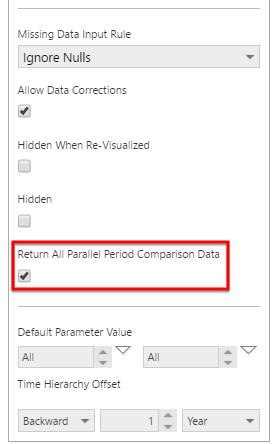
In the Configure Metric Set Element dialog, select the Return All Parallel Period Comparison Data checkbox and click Submit.
The chart now displays all of the period over period values, which includes dates where there are no OrderQty values.