
1. Overview
Use the System Health options in the administration interface to:
- Examine the application log for any errors or warnings
- Manage running and scheduled jobs as detailed below, including data cube storage and notifications
- Verify email settings by sending a test email
- Run health checks and fix identified issues
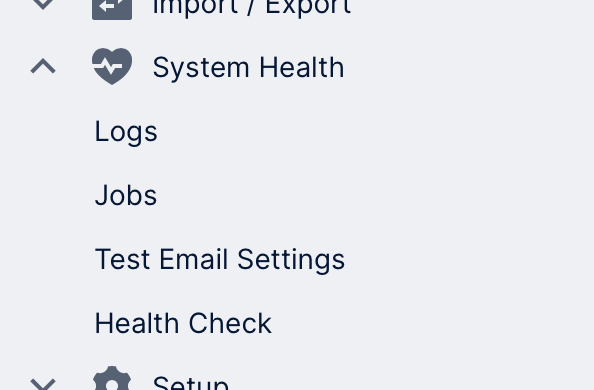
2. Viewing logs
The application log can help you to troubleshoot operational warnings or errors.
See Application logs for details on accessing the log and configuring log filters.
3. Managing jobs
3.1. View all jobs
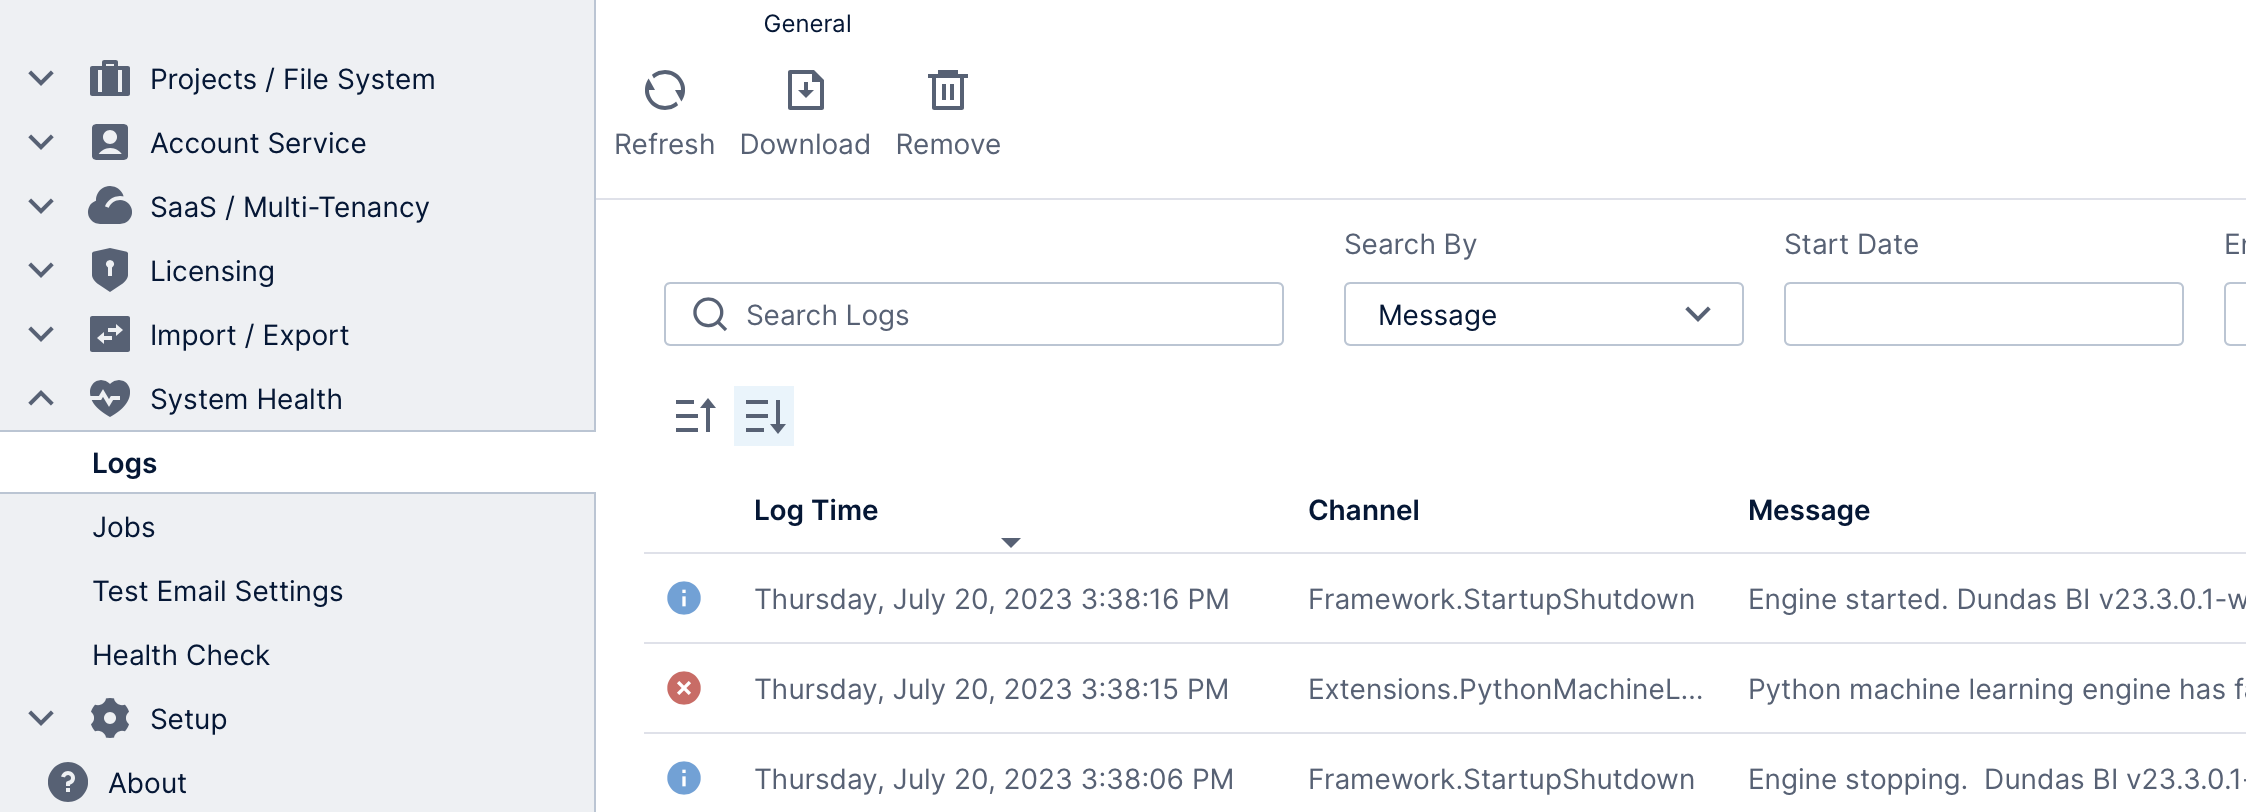
Click to expand System Health along the left side of the administration area, then click Jobs to monitor the status of past, scheduled, and currently running jobs. The following kinds of jobs can be listed:
- Update In-Memory Cube – Builds in-memory storage for a data cube. May also be a sequence job that builds storage for multiple cubes as a batch.
- Update Data Warehouse – Builds data warehouse storage for a data cube. May also be a sequence job that builds storage for multiple cubes as a batch.
- Notification – Execution of scheduled notifications including data-driven notifications.
- Maintenance – Built-in jobs that can perform regular maintenance, performed by the system service:
- System cleanup – Deletes expired records from the application database (log entries, performance statistics, usage tracking data, etc.). Control the frequency of the cleanup job and the expiry interval of the records in advanced configuration settings, or from the toolbar when viewing the job details.
- Rebuild indexes – Rebuilds the indexes in the application and warehouse databases to avoid index fragmentation. Schedule or disable/enable the job from the toolbar when viewing the job details.
- Health checks (version 23.2 and higher) – Runs health checks automatically at the scheduled interval, and can automatically fix issues and/or email the configured maintainer email address in case of issues. View the job details to enable and schedule the job, and set it up using the Health Check category of configuration settings.
Jobs are listed in a table providing the following information:
- An icon indicating the result of the last job run.
- An icon indicating the status of a job (idle, running, disabled, deleted).
- An icon indicating the kind of job (in-memory, data warehouse, notification, cleanup).
- A description of the job.
- The tenant the job is associated with if applicable.
- The last run date and time.
- The last run duration.
- A description of the latest event.
- The next run date and time.
The legend above explains what each icon means, or you can hover over (or long-tap) an icon in the table to see a descriptive tooltip.
3.2. Filter and sort jobs
Use the options at the top of this page to help you find certain jobs:
- Search Jobs by their description or ID. Descriptions often include project and data cube names, for example.
- Use the dropdowns to filter by Job Kind or Job Status.
- Click the Last Run Date box and use the calendar to choose a specific date for filtering the job entries. For example, you can easily click to show only jobs that ran Today.
- Use the Order By dropdown to sort the jobs by the last run date or the job creation date. The buttons after this let you switch between ascending or descending order.
- If your instance is using multi-tenancy, click Select tenant to choose a tenant and view only the jobs specific to that tenant.
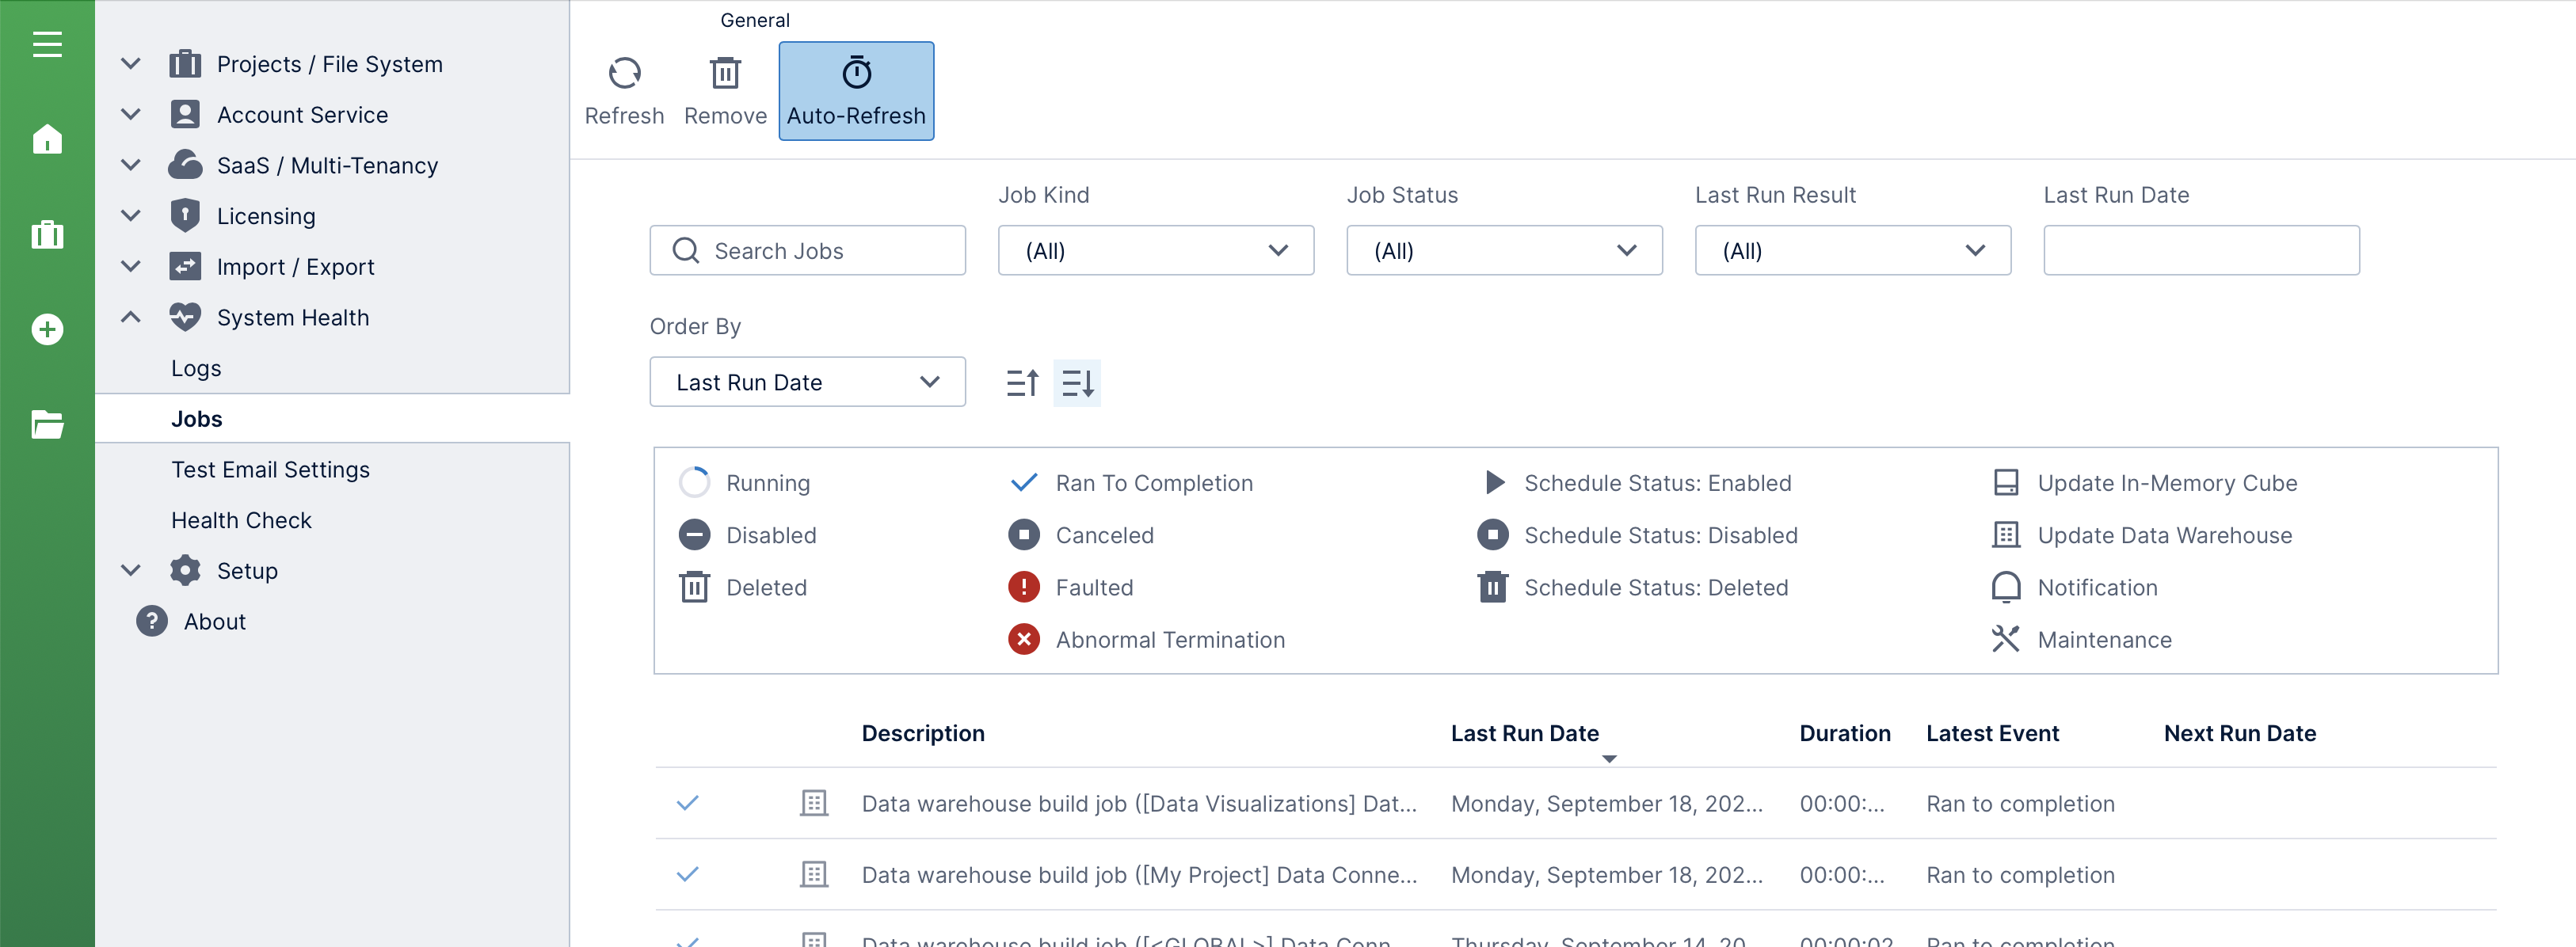
3.3. View and edit job details
From the main Jobs page, click to select a job in the list and then click Details in the toolbar to access its details including its run history. You can also double-click or right-click to open the details.
In the job details toolbar, you can:
- Manually Run the job or Cancel it if it's currently running
- Disable a job. This button acts as a toggle and is highlighted if the job is disabled.
- When the Job Failure Email Policy is set to notify the Job Maintainer in version 23.3 and higher, click to Notify on Failure a particular user that you choose. This user is then displayed in the corresponding field in the details listed below. If there is a parent job, click View Parent Job first and set the job maintainer on it instead.
- Modify the schedule of any scheduled job. If this job is for data cube storage for a specific tenant when using tenant overrides, you can optionally create a schedule for the tenant separate from the main parent job that otherwise runs for all tenants.
- Disable Auto-Refresh while viewing this page if you prefer, otherwise the job details will be automatically refreshed every several seconds.
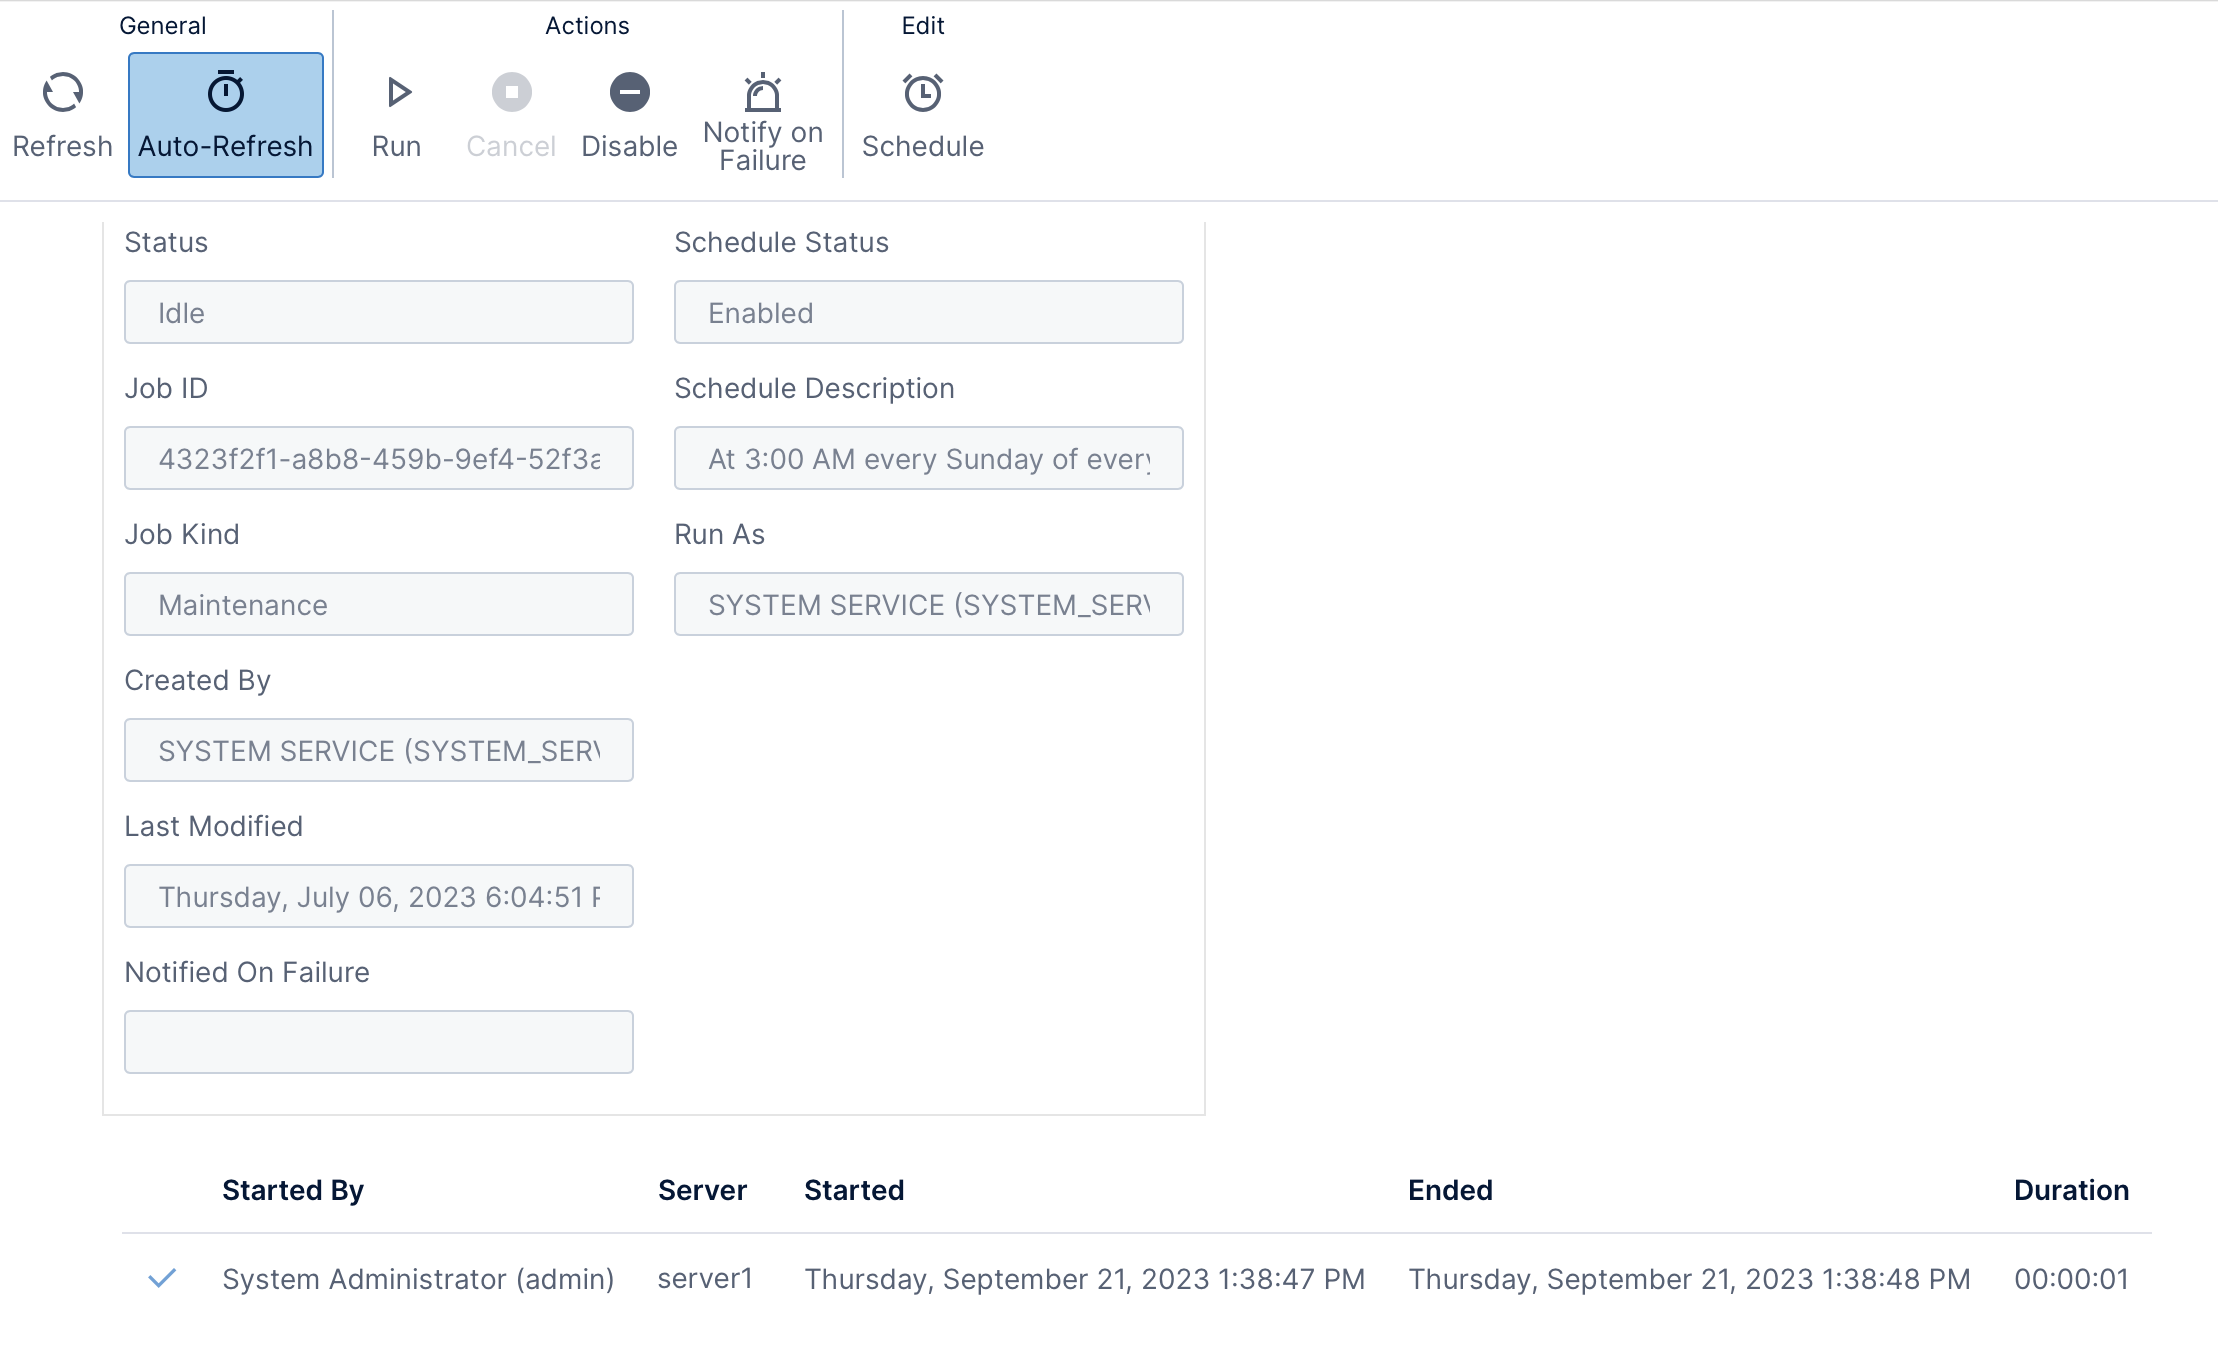
A table lists each time the job has run, including if one is in progress as indicated by an animated icon.
There are additional details about each time a job has run, which you can view by selecting a job run from the list and clicking Details in the toolbar.
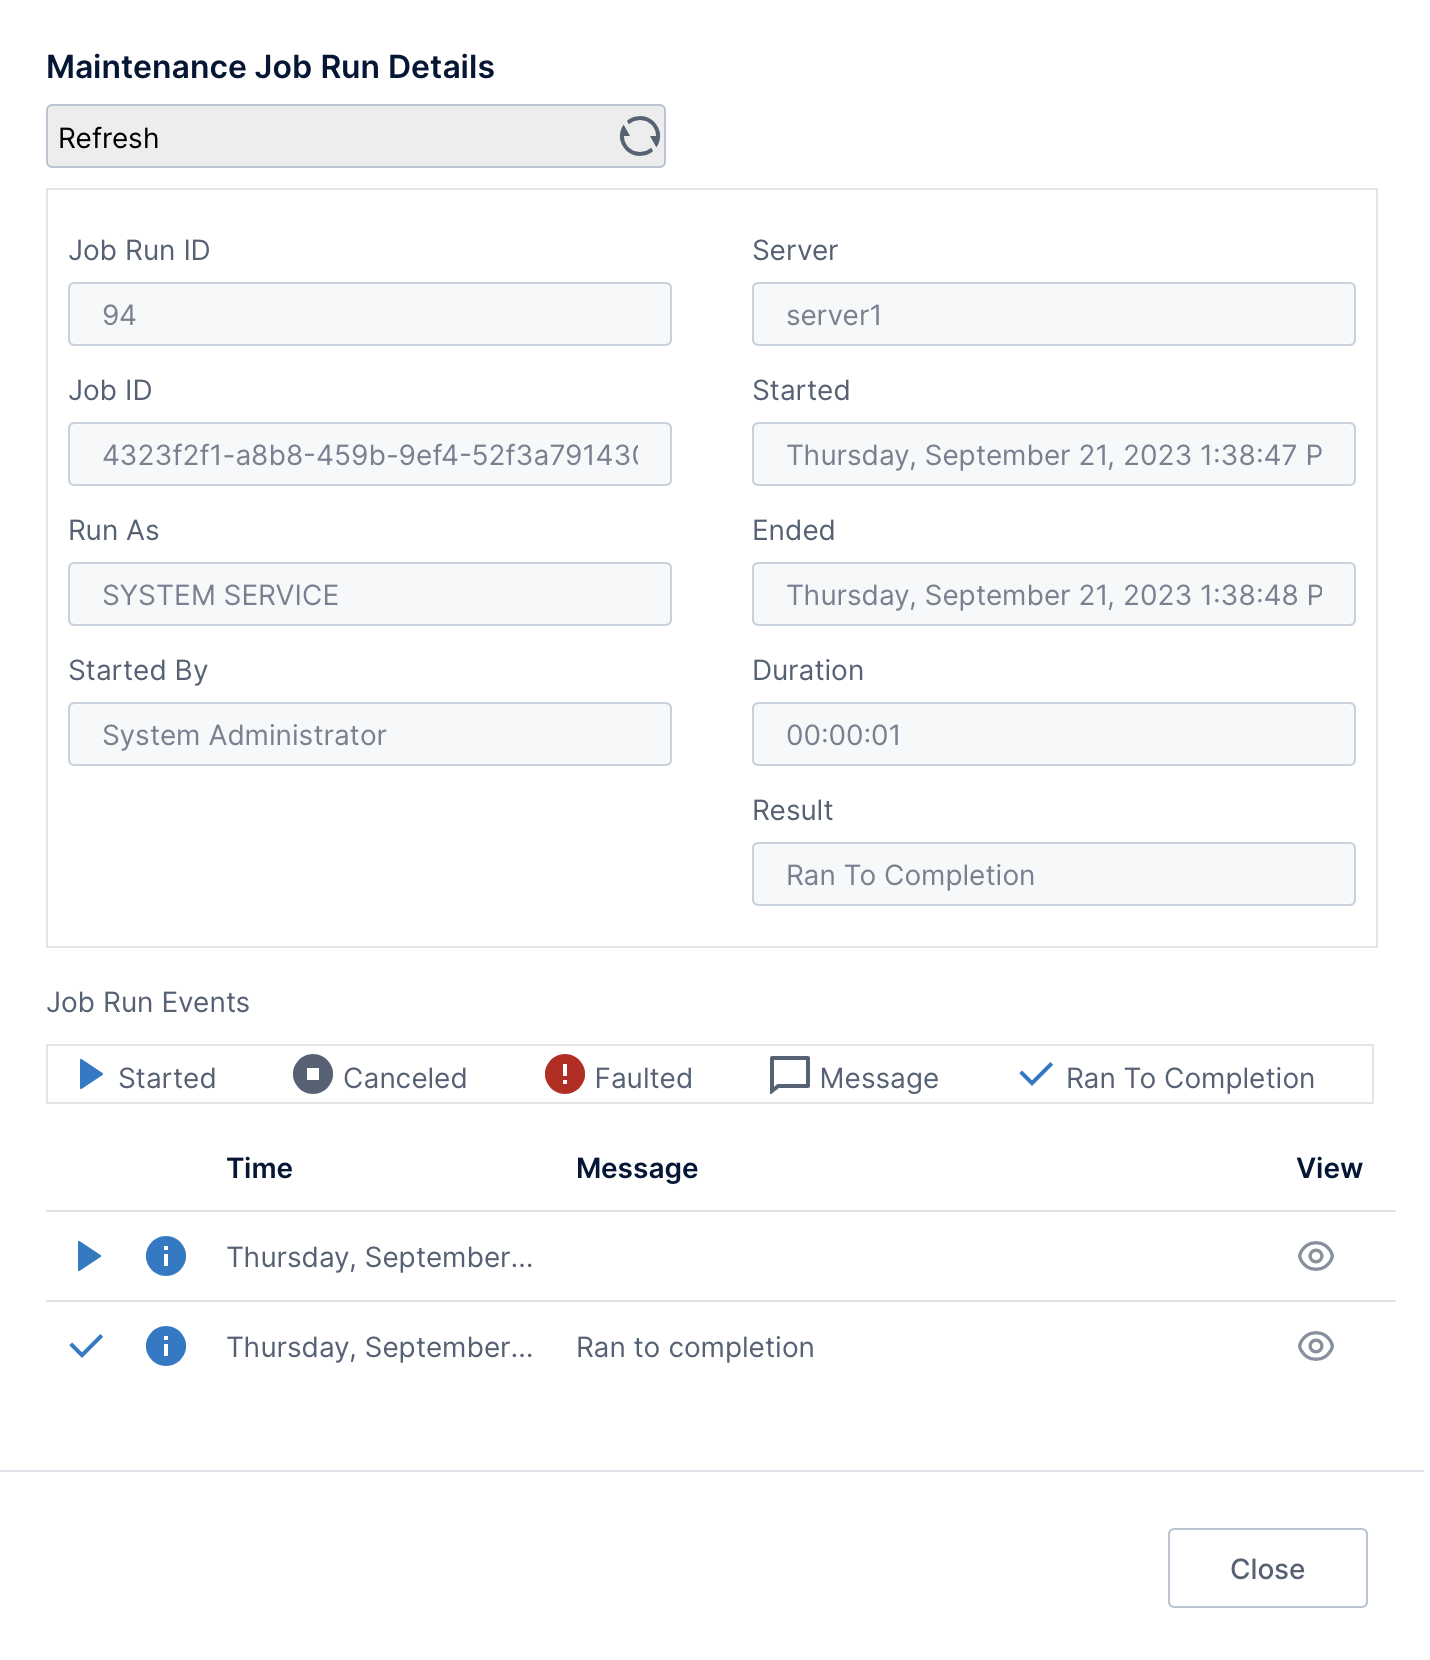
A dialog opens with job run details, including a list of events that have occurred while running the job. The list of events may include details about its progress, or an error message if there was a failure.
Click the View icon for an event to view the entire message or to copy it. Click the Close button at the bottom of the dialogs to return to the job details.
To return to the list of all jobs, go back using your browser or click Jobs again in the sidebar to the left.
3.4. Clear old job data
By default, the data associated with a job is cleared automatically based on the Job Data Maximum Age configuration setting. This is set to 30 days initially, which means job data is cleared once it becomes older than 30 days.
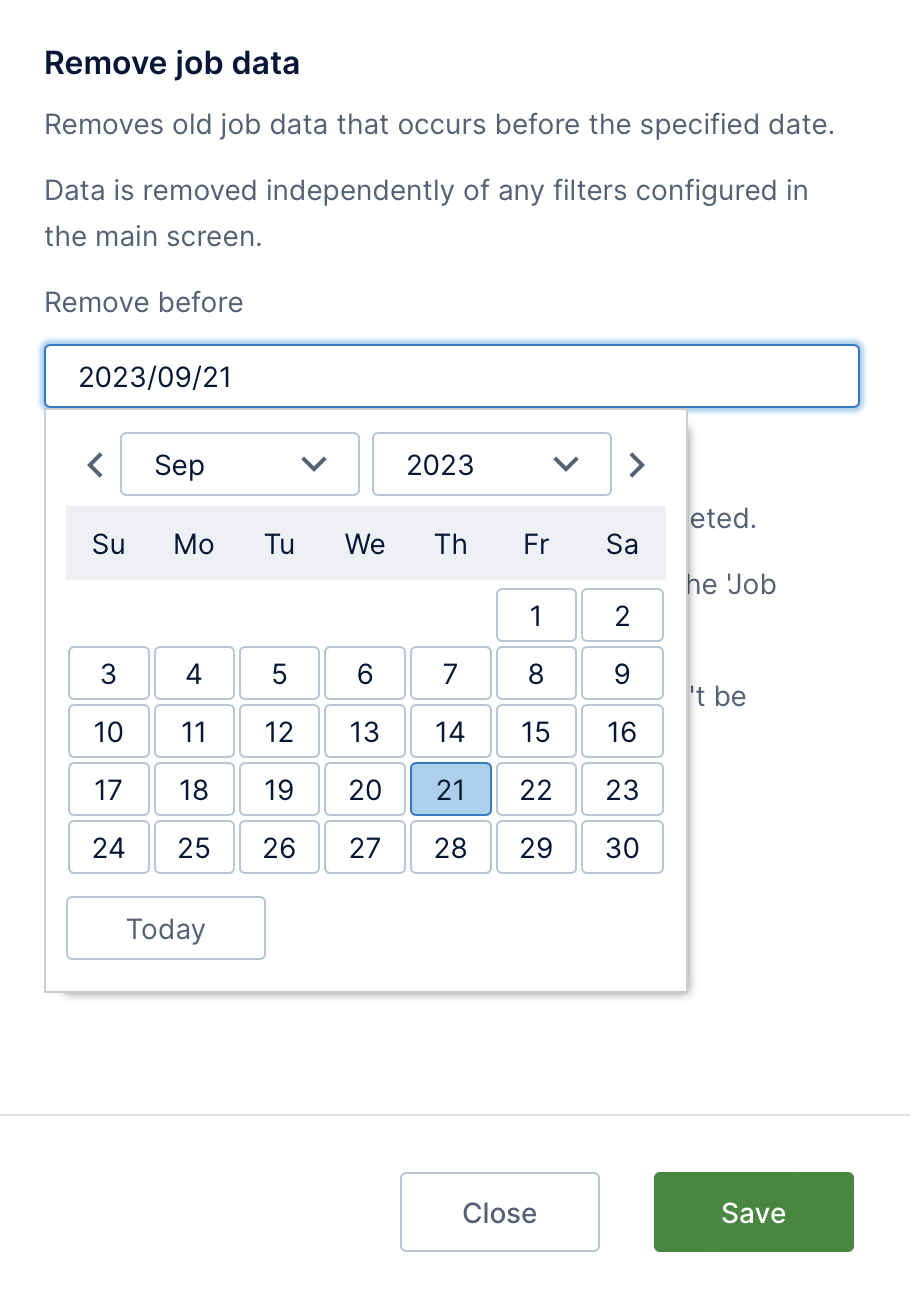
If you want to manually clear job data yourself, you can do so from the main Jobs screen by clicking Remove in the toolbar.
In the Remove Job Data dialog, click the box under Remove before, and then use the calendar to select a date. All job data older than this date will be cleared. Click Submit to clear the data.
3.5. Configure job failure emails
Users can be notified by email when a job fails by setting up the Job Failure Email Policy in the application configuration settings. This can be set to notify any combination of:
- The Application Maintainer (this is either the built-in System Administrator user, or the address from the Maintainer Email Address configuration setting if set).
- The creator of the job (for data cube storage, this may be the user that created the data cube or first set up its storage – to confirm, you can view a job's details).
- The runner of the job when run manually, otherwise the creator of the job can be notified instead when scheduled.
- A designated job maintainer in version 23.3 or higher, which can be set for each job from its details page in administration, by developer users when editing a data cube using storage, or when any user sets up a notification that runs on a schedule.
There is also an advanced setting Job Failure Email Throttle Period that can prevent multiple emails from being sent within the specified period.
3.6. Automatically retry jobs
In version 23.3 or higher, you can set up your application instance so that failed jobs are automatically retried up to the specified total number of attempts. For example, a data cube storage job might have failed only due to an intermittent database connection issue and could be successful if attempted again.
In configuration settings, set the Job Execution Attempts Count. A job failure email will only be sent if all attempts failed.
4. Testing email settings
Email settings must be configured properly in order for certain features such as notifications to work properly.
To check your email settings, expand the System Health options and click Test Email Settings.
Type an email address to receive a test email and then click Submit.
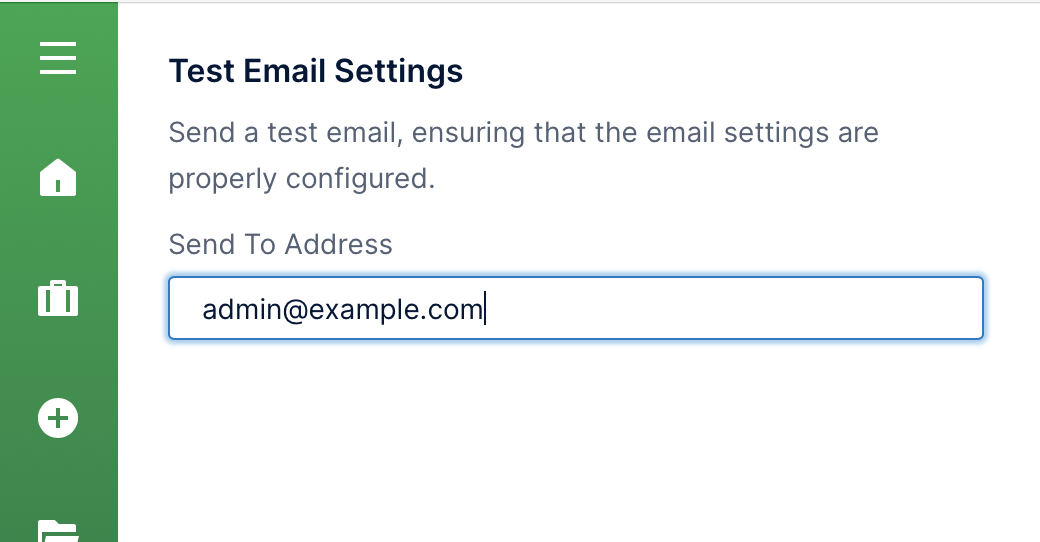
Check the appropriate inbox for the test email which will have the subject line: Dundas BI test email.
5. Health check
Your application instance can automatically check itself for potential issues, and provide you with details and the option to fix issues automatically.
For details, see the Health check article. To schedule health checks to run themselves automatically and fix or report on issues, see the details above about this built-in maintenance job.