1. Overview
You can set up states on a metric set to display some data differently when it falls within that state based on comparisons with other values.
They can be used to call attention to certain data or to otherwise customize visualization settings for certain data by setting up its State Styles.
States are defined as part of a state group, which is a set of related states for evaluating the same measure, such as Good Sales and Bad Sales. You might have multiple state groups if a single value could represent multiple states, such as a value that is both above the sales target ("Good") and lower than this time last year ("Trending Down").
Related video: States
2. Setting up states
States are saved as part of your metric set so that they are reused when switching between visualizations or when visualizing a metric set multiple times. (The metric set will need to be checked out to you to set up states if it has been checked in.)
2.1. Create a metric set
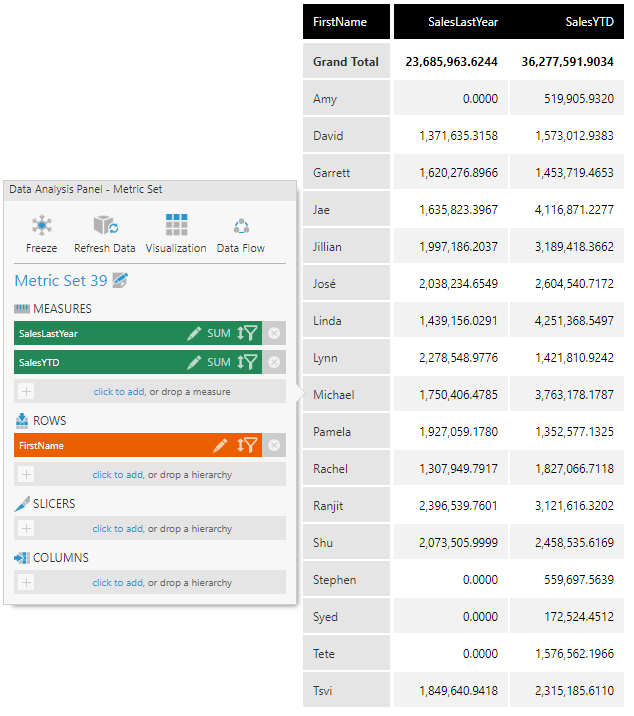
As an example, create a new metric set from the main menu. You can also set up states when editing a metric set on a dashboard or on any other view.
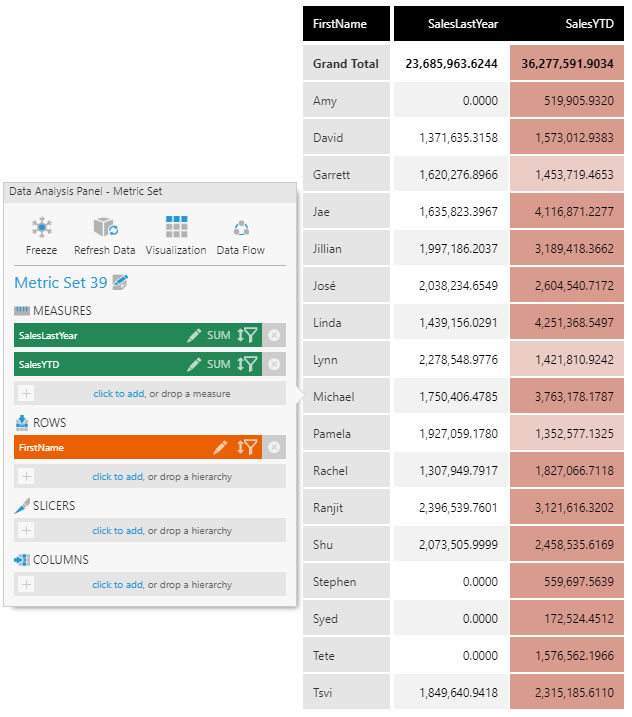
Drag two numeric columns (measures) for comparison purposes.
Drag a column of text or date values (a hierarchy) to Rows in the Data Analysis Panel.
2.2. Add a state
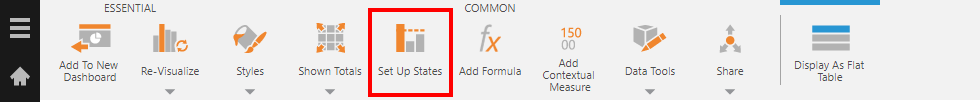
To create a state, click Set Up States in the toolbar. When editing a dashboard or another view, you can find this option under Data Tools.
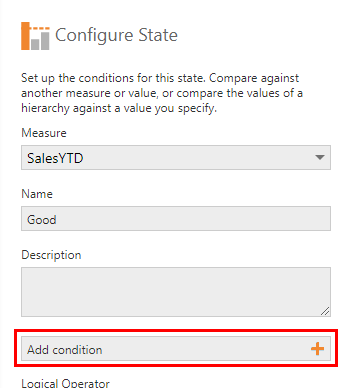
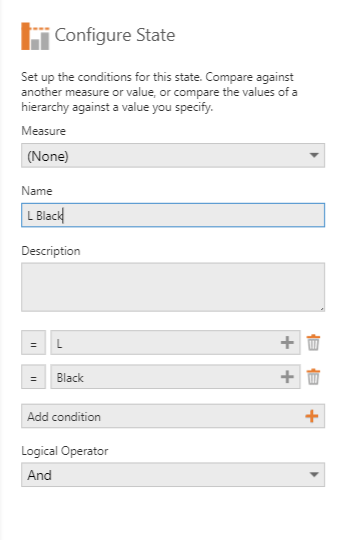
If this is the first state in this metric set, the Configure State dialog appears immediately.
In the Measure drop-down, choose which numbers determine your conditions. You can leave this as (None) if you are only comparing hierarchy values.
You can enter a preferred Name to identify this state.
Click Add condition.
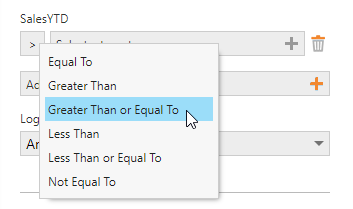
To change the operator used to compare against your measure, click the Greater Than sign button and choose another option such as Greater Than or Equal To from the drop-down menu.
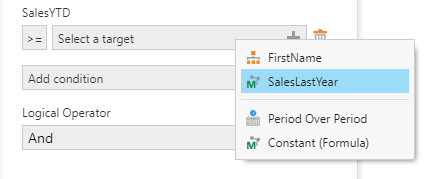
Click Select a target and choose what to compare against in your data.
This can be another measure or hierarchy you already added to the metric set, including a formula. If you select a constant or a hierarchy (orange icon), you will also enter a specific value to compare against - see the examples below for details. The Period Over Period option will open a dialog to add a new comparison against another time period to use for this state.
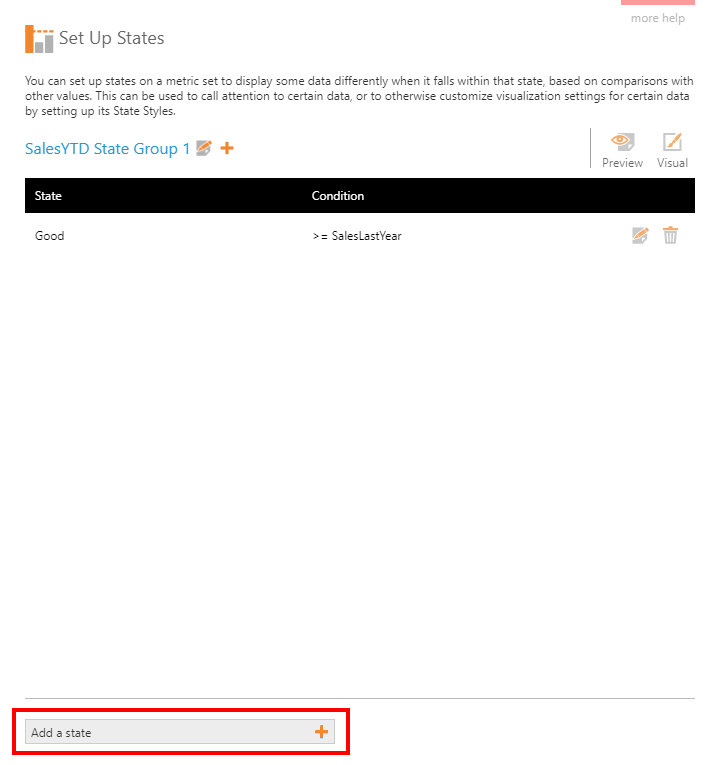
Click Submit to create a new state group with your new state.
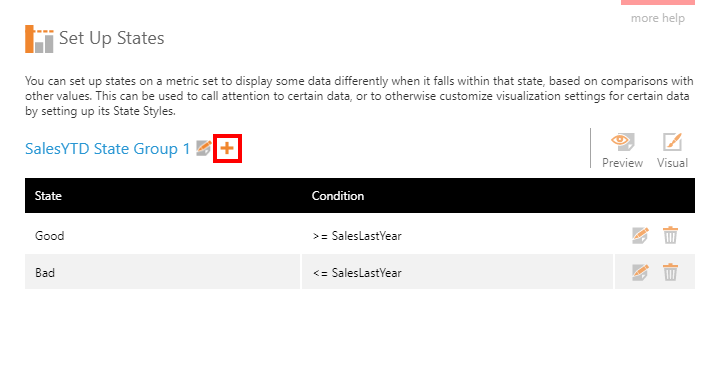
For our example below, we will repeat these steps with a Less Than comparison operator to create a Bad state.
In the Set Up States dialog, click Add a state near the bottom of the dialog to add another state to this state group.
Repeat the steps to configure the state.
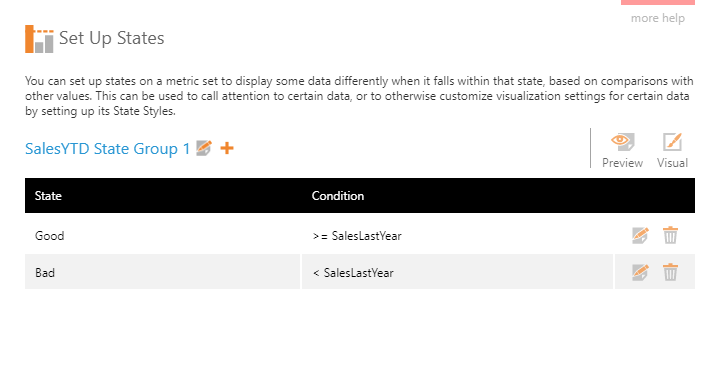
Close the Set Up States dialog (or click the Preview button) to see your visualization updated with default settings reflecting your states.
2.3. Add another state group
You can set up another state group to check for an independent set of conditions. A value could then be considered to be in more than one state at a time: for example, one state from a group named Vs. Target and another from the group Vs. Last Year.
In the Set Up States dialog, click the plus button next to your existing state group name to add a new one.
After creating the new state group, you can click Add a state.
3. Visualizing states
Each visualization can use states in different ways, so the visual-related settings are located in the Properties window for the visualization. Some initial settings will be applied for you, or you can find the State Styles property that corresponds with what is displaying those values and customize the settings.
For example, a table visualization has state styles that can be applied in each column: click on a column in the General (or Main) tab.
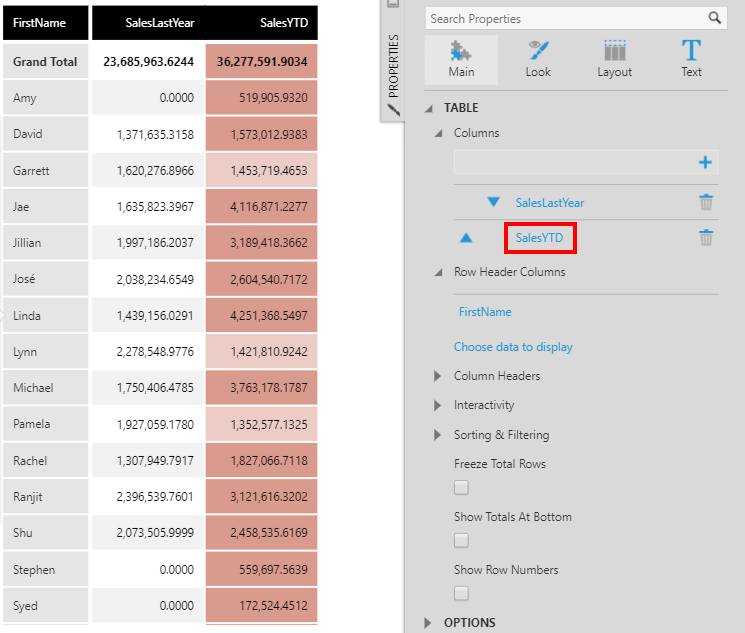
In the column's properties, find the State Styles.
If your state group applies to this column's data, you will see state styles added automatically. You can also add your own and assign their State property to your state.
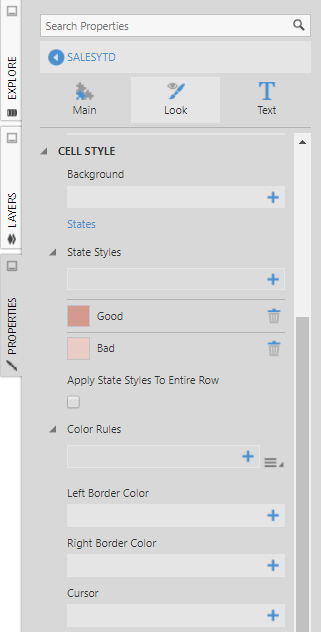
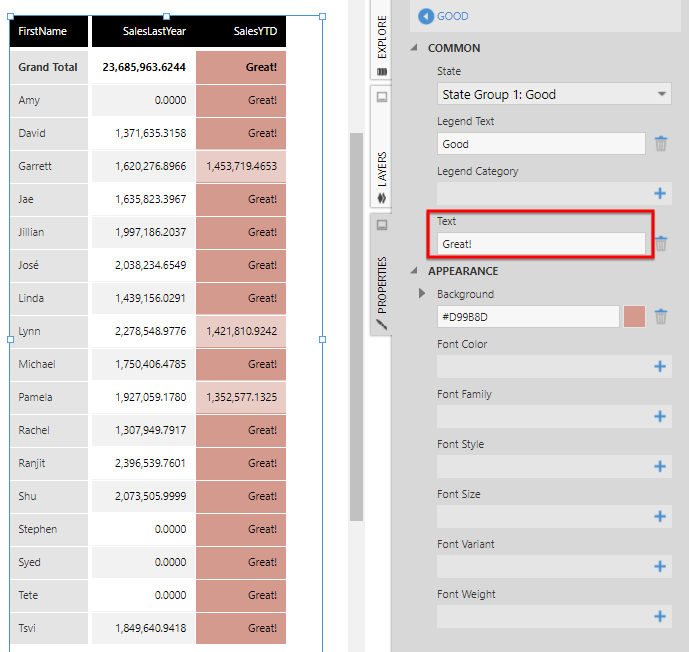
Click a state style to edit its properties. For example, change the Text for the Good state.
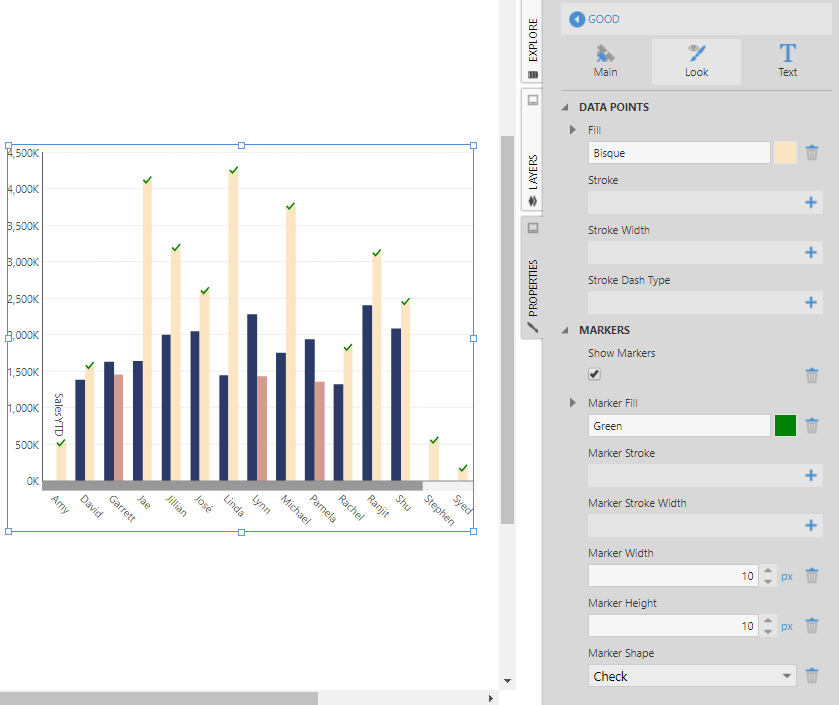
When re-visualizing, notice that the state style options are visualization-specific and have changed. For example, here is our table re-visualized to a Bar chart. In the State Styles found in the data point series, the fill color has been changed and markers added for the Good state.
4. Examples
4.1. Comparing against a constant
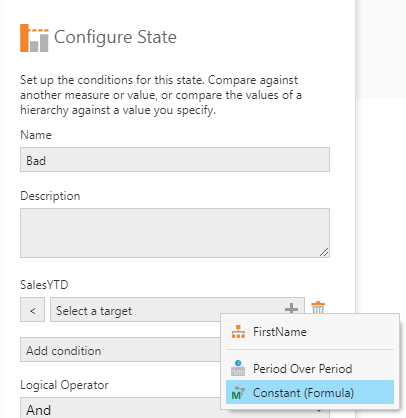
In the Configure State dialog, you can add a condition that compares your measure against a constant numeric value.
Click Select a target and choose the Constant (Formula) option.
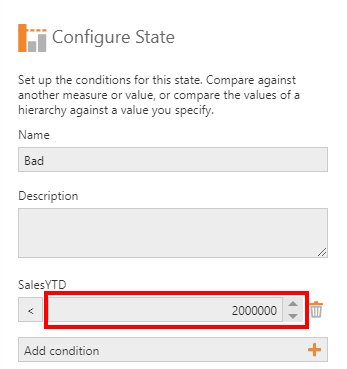
Type the constant value in the numeric text box and then click Submit.
A new measure is added to the metric set with the caption Constant (value).
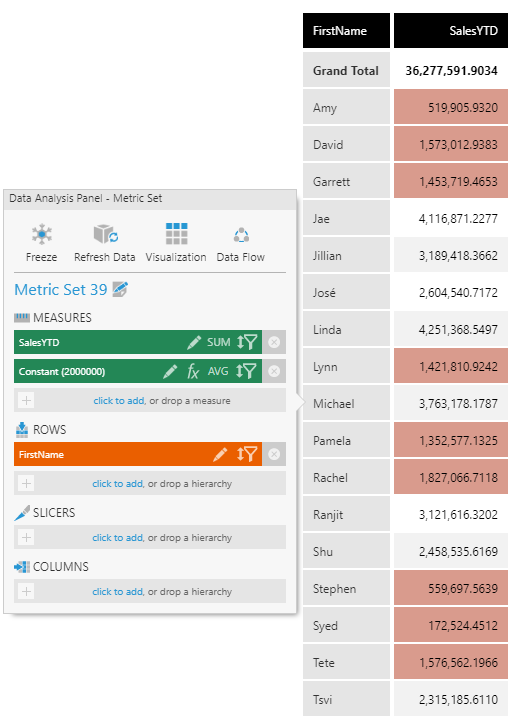
The constant is created as a formula measure. If you need to change the constant value you can do so by clicking its fx button in the data analysis panel. You can also update its caption by editing the measure from the data analysis panel.
4.2. Comparing against a hierarchy
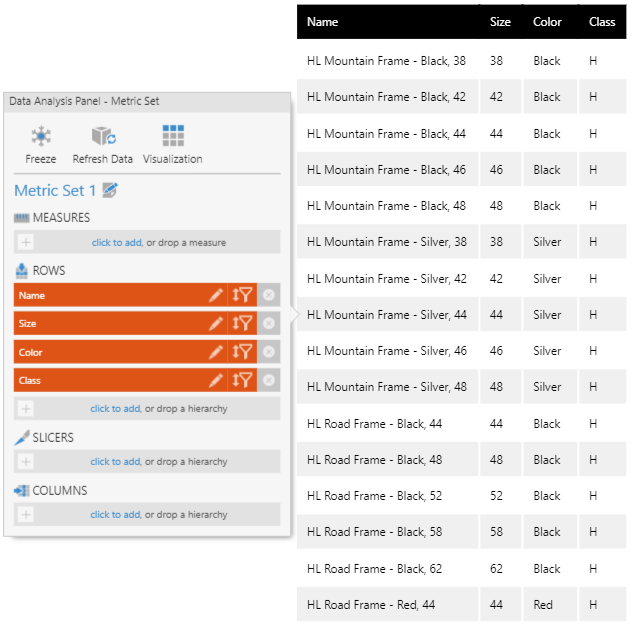
You can also add conditions in the Configure State dialog to check against text or date/time data, even if you associated your state group with a measure. For example, add two conditions that compare the Date value in each row of data to highlight all values between two dates. Or, you can set up a state to highlight Sales values of products that have a Color hierarchy value equal to Silver.
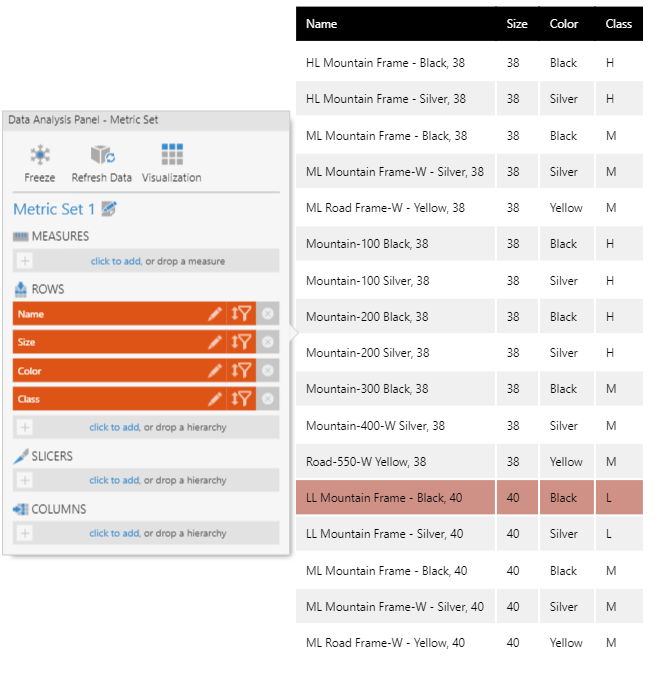
For the following example, create a table that displays various data made up of text values and dates (measures are not required for this example).
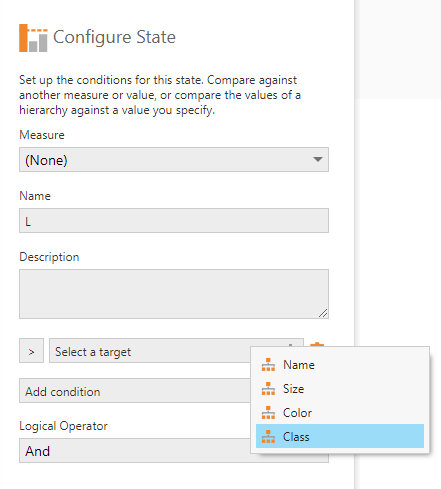
Add a state. Since we are not checking measure values, leave the measure as (None).
In the Configure State dialog, click Add condition, then click Select a target and choose the values you want to compare.
Next, the first button displays an operator such as an equals sign, which you can click to change. Date/time data can be compared using additional operators such as Greater Than.
Click the button next to it to choose which specific value to compare against.
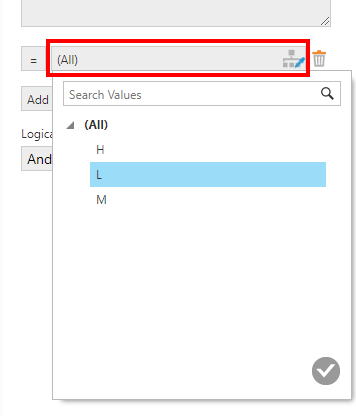
You can add more conditions. In the example shown below, we're checking for rows with a particular Class value And a particular Color value according to the Logical Operator setting.
The resulting metric set highlights values matching both conditions.