
Add Some Heat to Your Map Visualizations

Phew! Check your AC, because things are heating up with Dundas BI 5!
Phew! Check your AC, because things are heating up with Dundas BI 5!
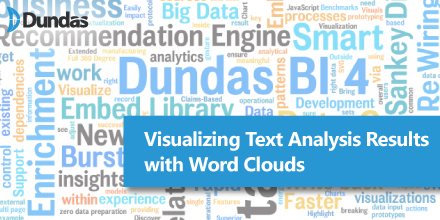
A Word Cloud or Tag Cloud is a visual representation of text data in the form of tags, which are typically single words whose importance is visualized by way of their size and color. As unstructured data in the form of text continues to see unprecedented growth, especially within the field of social media, there is an ever-increasing need to analyze the massive amounts of text generated from these systems. A Word Cloud is an excellent option to help visually interpret text and is useful in quickly gaining insight into the most prominent items in a given text, by visualizing the word frequency in the text as a weighted list.

What. A. Year!
To say that 2017 was wild would be an understatement. Dundas turned 25, and that wasn’t even our most compelling feat! But now that 2017 is finally coming to an end, we can take a moment to reflect on all the excitement from this past year.
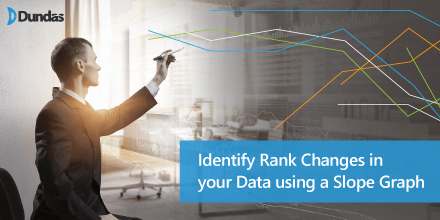
A Slope Graph is essentially a line chart variation that is typically used to emphasize change in time for different categories in your data and how each stacks up against the other.

Many people see the use of voice in analytics as entirely arbitrary, and as an alternative to mouse or keyboard controls. Some think of it as just a gadget or gimmick to generate attention.
We don’t agree.
Voice has the potential to completely revolutionize how business intelligence (BI) systems are designed, built and used.
Dundas Data Visualization, Inc.
400-15 Gervais Drive
Toronto, ON, Canada
M3C 1Y8
North America: 1.800.463.1492
International: 1.416.467.5100
