What does it mean to be king? Just ask content creator and distributor extraordinaire, Netflix. In a recent study, Netflix was shown to have the best original content in comparison to not only other on-demand streaming services but to any television subscription service (sorry HBO and Game of Thrones).
For BI and analytics projects to be successful and transform the way people manage their decisions, speed is often a necessity. It’s not enough to have the right KPIs or the ability to consume those easily; the capacity to Get Insights Faster™ over taking a coffee break every time a dashboard is loaded or a new business question is asked is imperative for success.
Navigating a business intelligence solution to find the exact dashboard or report you are looking for can be a daunting task if you are not familiar with the solution, and especially if you are not the one who authored the content. As the content author, it’s made more difficult when an organization’s standard users all have varying preferences regarding the navigation experience. Adoption is vital to the success of a business intelligence project, and a superior navigation experience can act as a catalyst for retaining a higher volume of standard users.
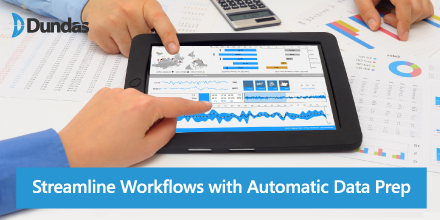
The process of preparing data to be used for visual data analysis is one of the most important steps for any BI project, and is often the most time consuming and difficult, especially if you are not that familiar with technical details such as inner joins or correlations formulas. Before you can transform your data into stunning dashboards, multi-page reports and visual data analytics, you must in fact, not only connect to data but actually make sure your data is properly organized.
The presentation layer of your business intelligence (BI) & analytics stack is your window into your company’s performance. By using data visualizations, you’ll be able to drive instant decision-making, which will lead to better results.