
1. Overview
This article shows you how to install and use sample dashboard projects provided by the installation tools, including dashboards administrators can use for usage and performance tracking.
A sample consists of a project that offers one or more sample dashboards which you can use or customize as needed.
2. Adding samples
You can add samples to your application instance regardless of how it is installed:
-
When running on Docker or Kubernetes, you can run the dundas-bi-setup Docker image to add samples to your instance. For Kubernetes, you can use kubectl to run the image inside your cluster – the following example refers to the repository used for Logi Symphony with the latest tag:
kubectl run -it --rm samplessetup --image=insightsoftware/dundas-bi-setup:latest
- For installations on Windows, use the Deployment application or wizard installed on the server and choose the samples option.
- For Dundas BI installed directly on Linux, run and use the Deployment wizard as shown in Installing Dundas BI on Linux, choosing the option to add a sample.
The next sections walk through this process for Dundas BI installed on Windows as an example, followed by details about the available samples and how to use them regardless of product or installation type.
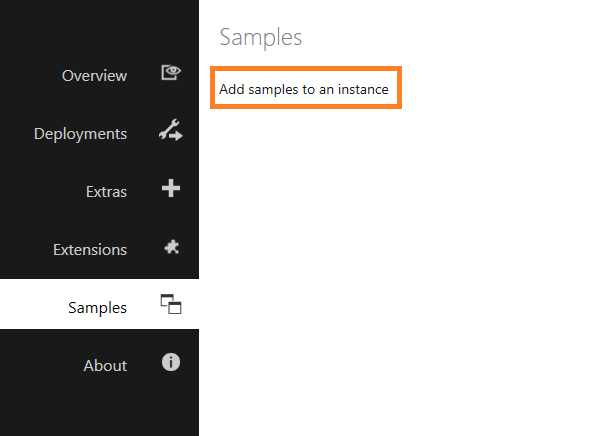
2.1. Launch the Deployment application
For Dundas BI installations on Windows, run the Dundas BI Deployment application, which lets you manage instances of Dundas BI on your server. This can be found in the start menu on the server computer, or you can launch it from its installed location.
Click Samples on the left, then click Add samples to an instance.
2.2. Select samples to add
In the Samples step, select the sample(s) you want to add.
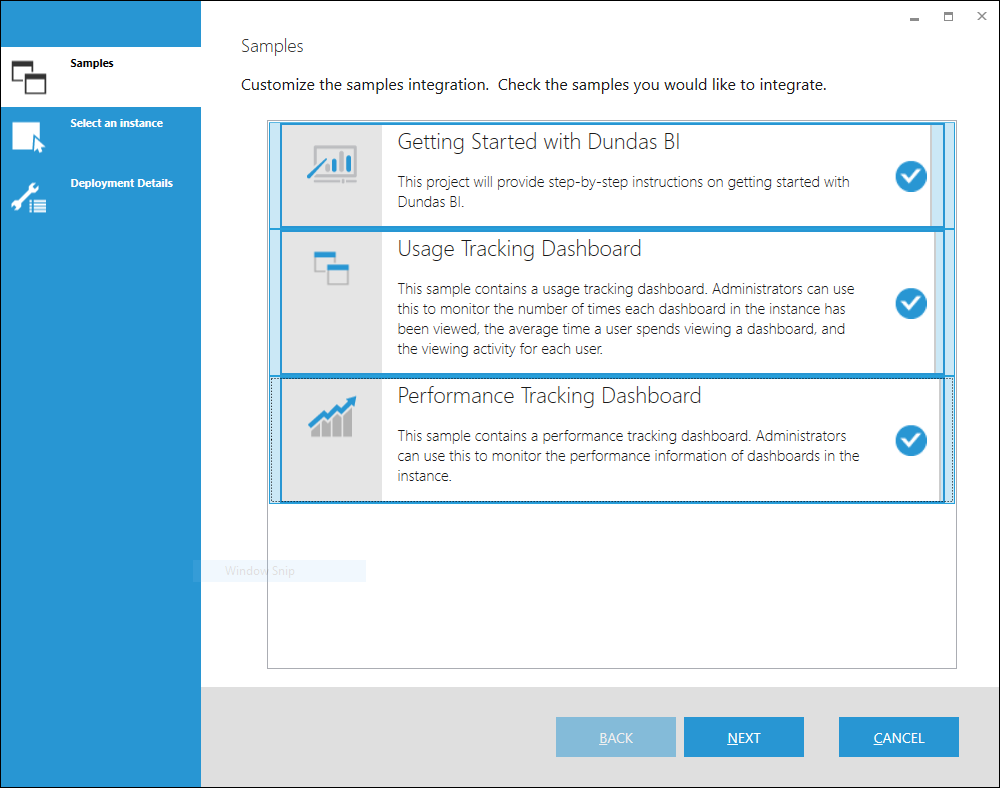
Click Next to continue.
2.3. Select an existing instance
In the Select an instance step, select the instance of Dundas BI to receive the samples.
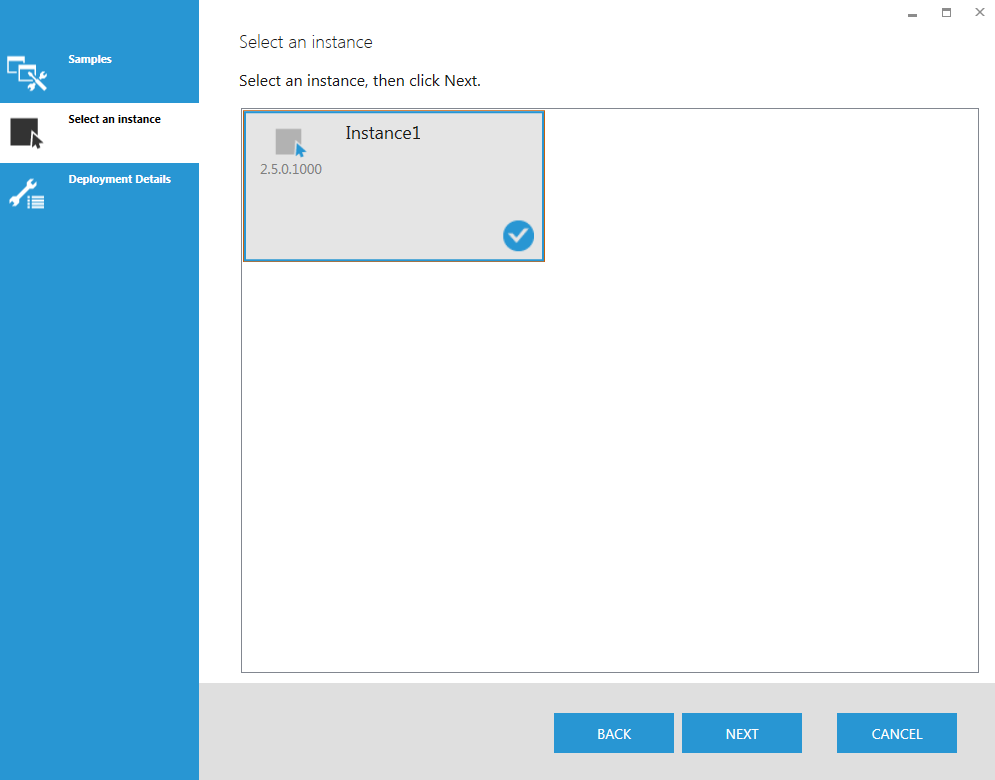
Click Next to continue.
2.4. Review details
This screen lets you review your selections before proceeding with the samples installation.
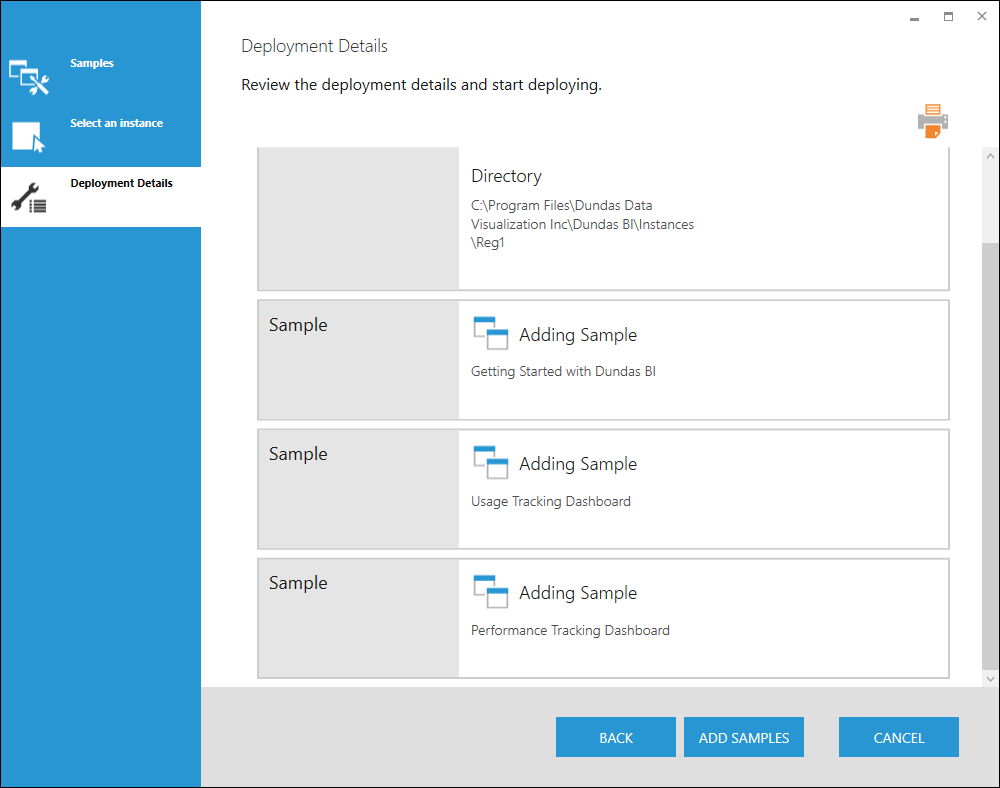
If everything looks fine, click Add Samples to begin installing.
2.5. Adding samples to instance succeeded
You should see the Adding samples to instance has succeeded screen when the installation is complete.
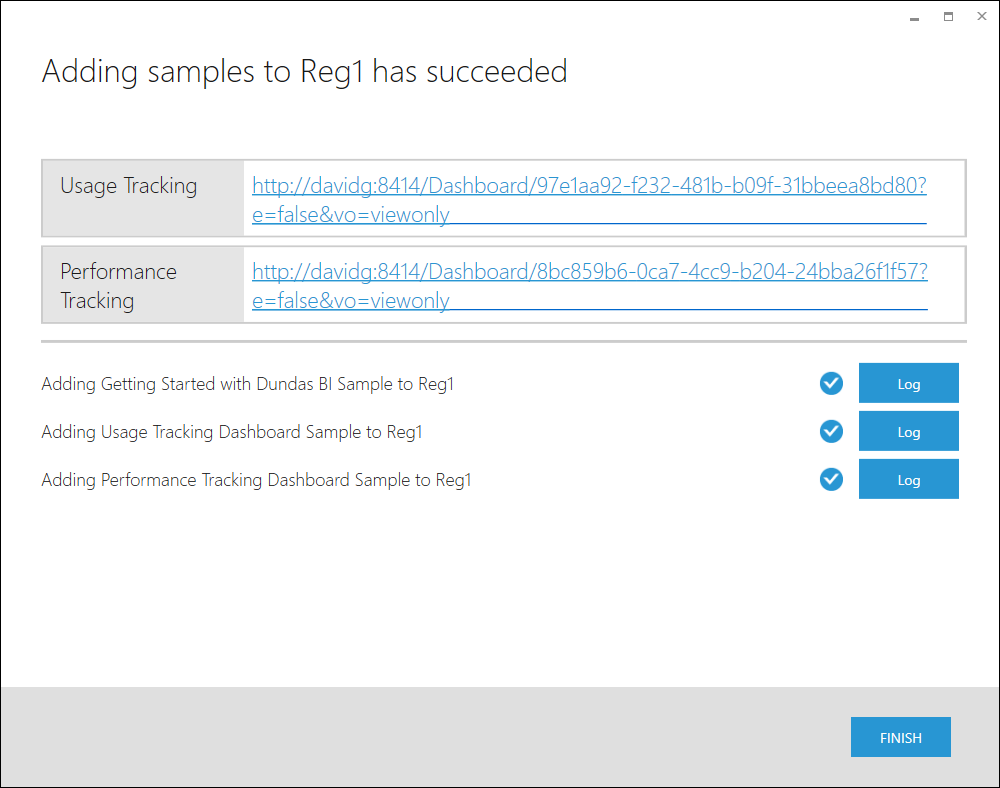
You can click the provided hyperlink to open each installed dashboard directly. (You'll be required to log on as an administrator.)
Click Finish to return to the Dundas BI Deployment main screen.
3. Using samples
3.1. Usage tracking dashboard
Usage tracking statistics are recorded in your application instance by default, and you can use the usage tracking sample dashboard to analyze this data. By default, only system administrators have access to this sample according to the file security privileges.
When logged on as a system administrator, use the main menu to switch to the corresponding project and open the sample dashboard for viewing.
![]()
The Usage Tracking Dashboard sample allows you to track the usage or viewing of dashboards, reports, and other views across users and projects.
3.2. Performance tracking dashboard
Performance statistics are recorded in your application instance by default, and you can use the performance tracking sample dashboard to analyze this data. By default, only system administrators have access to this sample according to the file security privileges.
When logged on as a system administrator, use the main menu to switch to the corresponding project and open the sample dashboard for viewing.
![]()
The Performance Tracking Dashboard sample lets you analyze the performance of metric sets (e.g., load times) used in dashboards, reports, and other views, across different projects.
3.3. Getting started
For the Getting Started project, start by opening the main dashboard called Start Here.
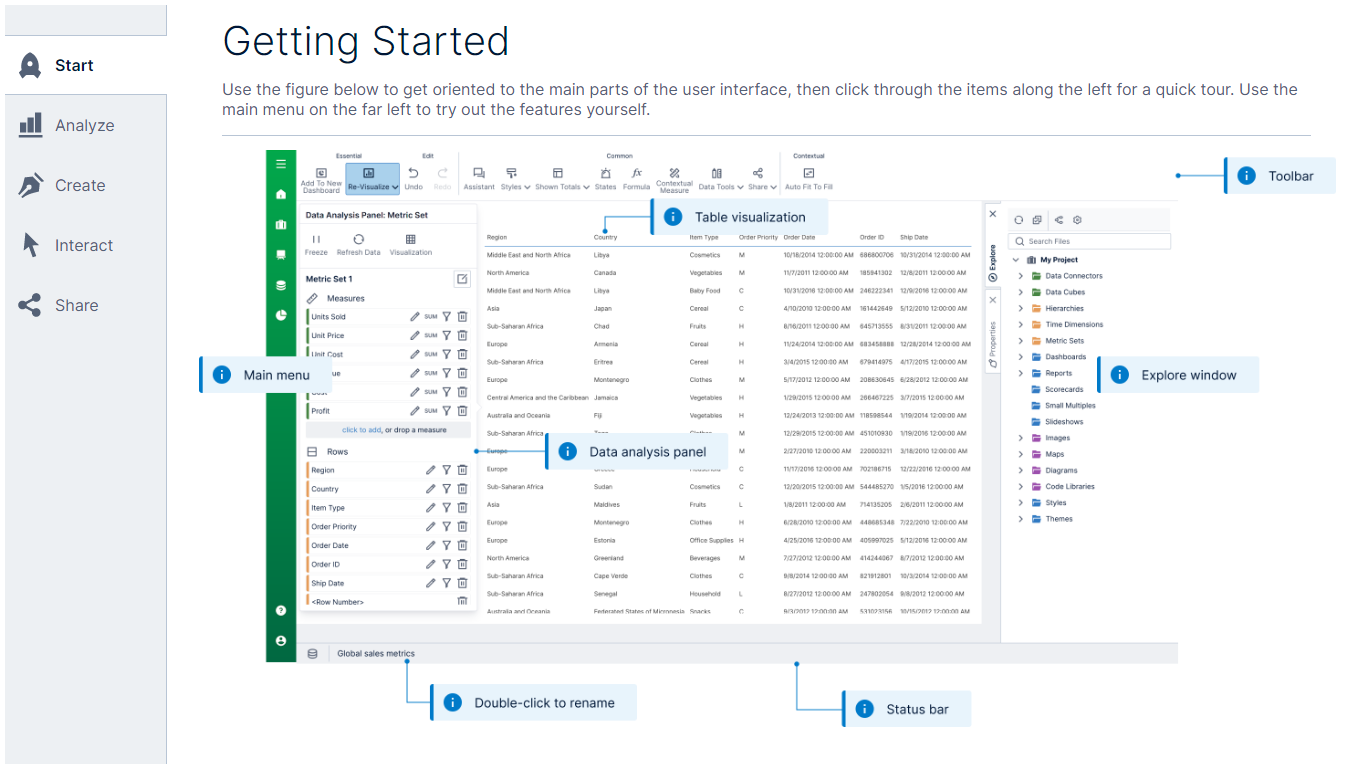
In this project you will also find dashboards, report, and scorecard examples, metric sets and small dashboards you can drag onto your own dashboard to combine them together, and sample data you can explore yourself in a new metric set.