1. Overview
In Dundas BI, metric sets determine which data to display, including totals according to the Shown Totals setting. Charts typically do not display total values alongside the original values, however, and have their own property setting that normally hides totals by default so that a new chart displays the data as expected.
This article explains how you can show or hide data points representing total values on a chart when totals are already set to display on the metric set.
2. Show total values
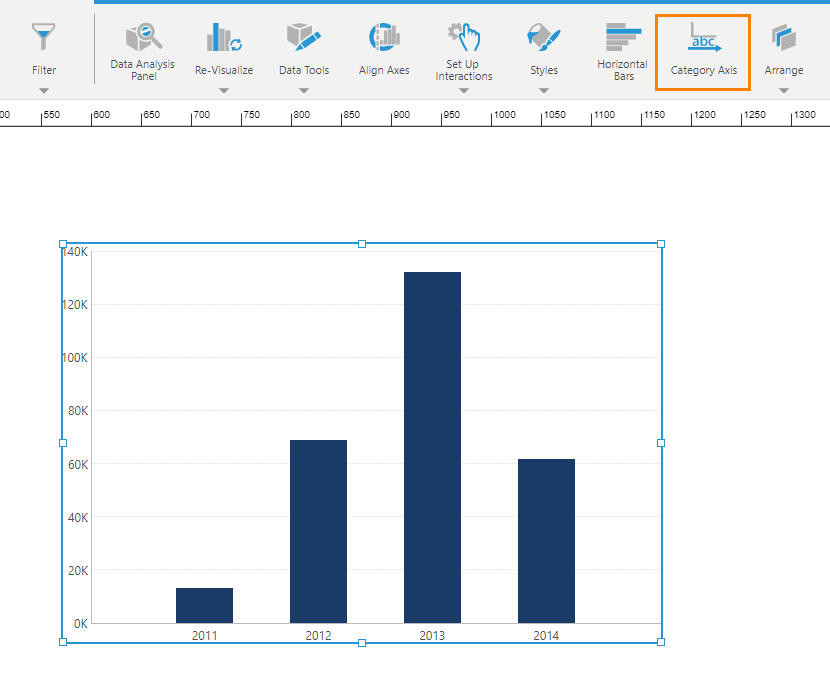
For this example, set up a chart to display OrderQty by OrderDate.
By default, the chart uses a Date/Time axis, but this won't work with total values. Go to the toolbar and change it to Category Axis which will give you expanders along the X-axis.
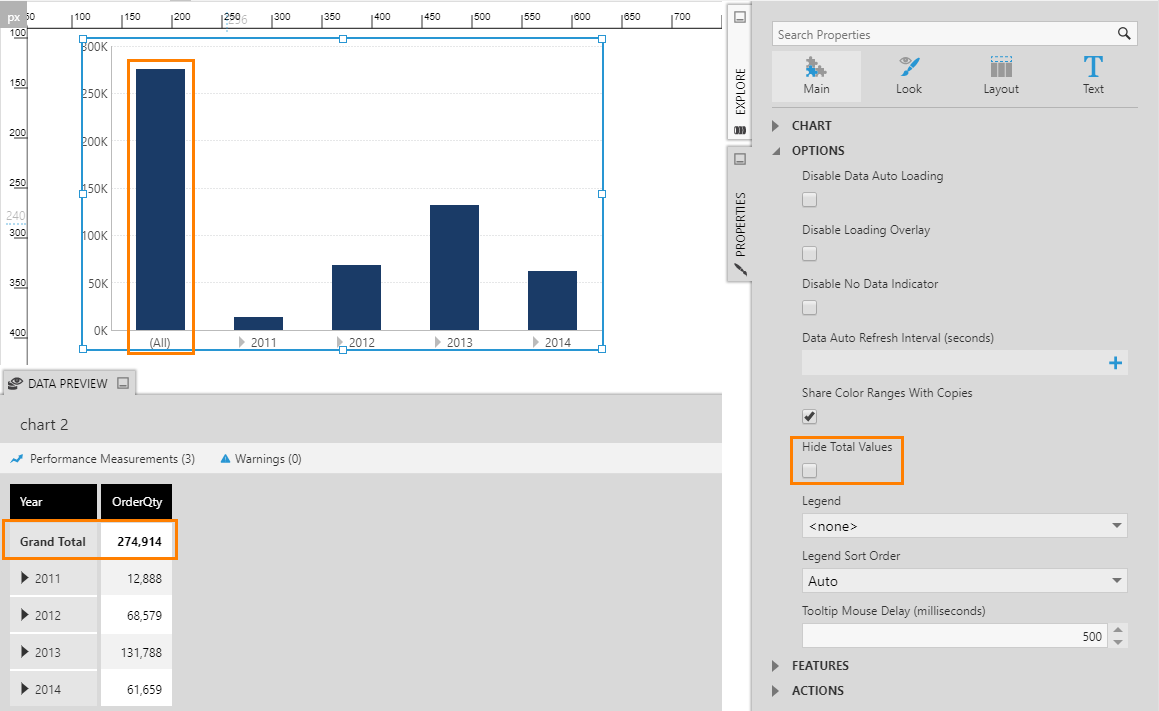
Go to the Properties window's General (or Main) tab, expand Data Points if applicable, and uncheck Hide Total Values. (For Pie or Waterfall charts, see the next section instead.)
Grand totals and subtotals are now displayed in the chart, for example an (All) bar data point added to the chart above representing the sum of the other bars. In the Data Preview, the Grand Total value in the table visualization corresponds to this newly added data bar.
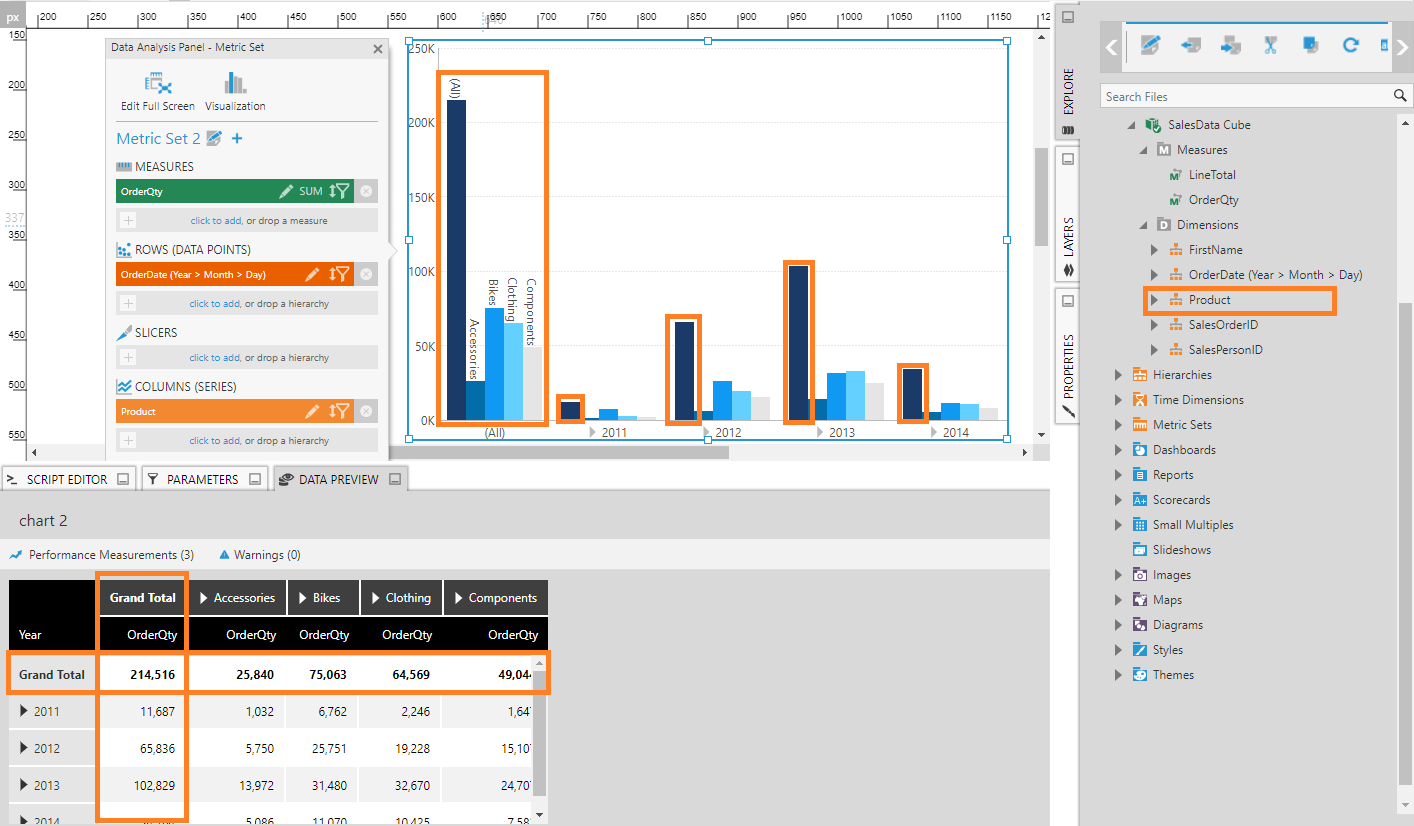
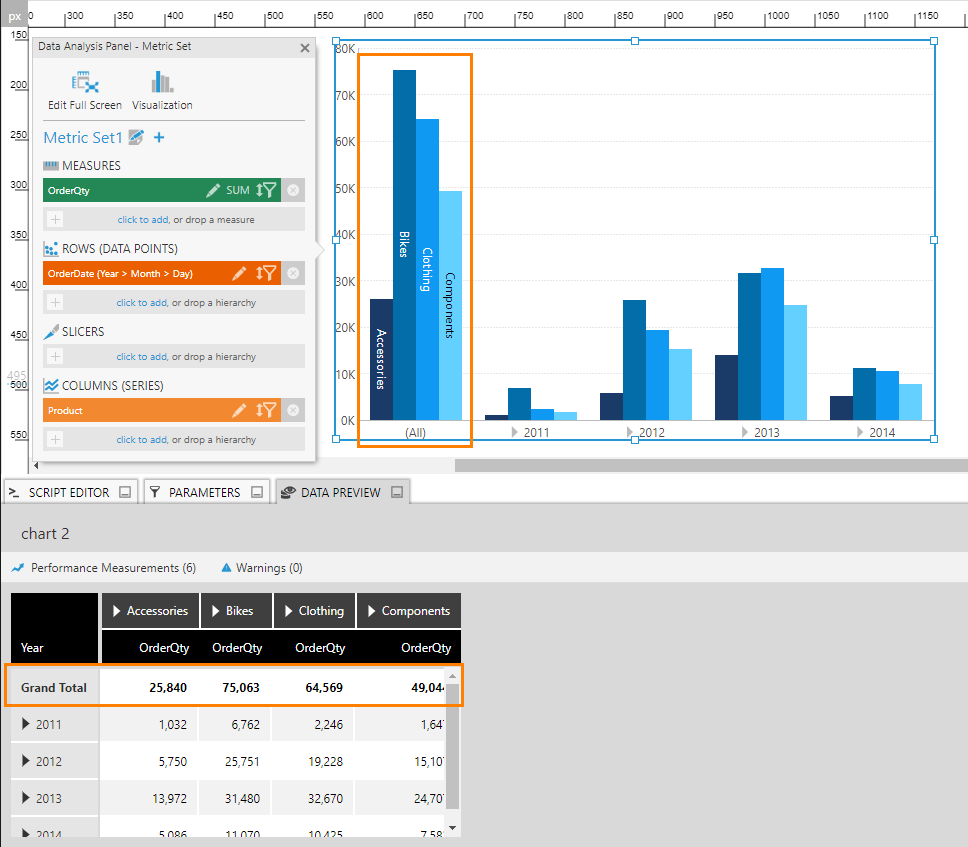
Next, open the Data Analysis Panel for the bar chart and drag the Product hierarchy under Columns. This will generate a chart series for each Product value plus an additional series which displays the grand total for each row or data point. Also, the (All) value turns into a cluster of total values, each representing the grand total for a specific Product.
Comparison of values in the above chart may be difficult because the total values are so much larger than the rest. You can improve the situation by hiding the total that is displayed at each cluster using the metric set's settings.
To do this, open the Data Analysis Panel for the bar chart and click the Edit button at the top. In the Metric Set Configuration dialog, set Shown Totals to Rows. (In a full screen metric set, you can also find Shown Totals in the toolbar.)
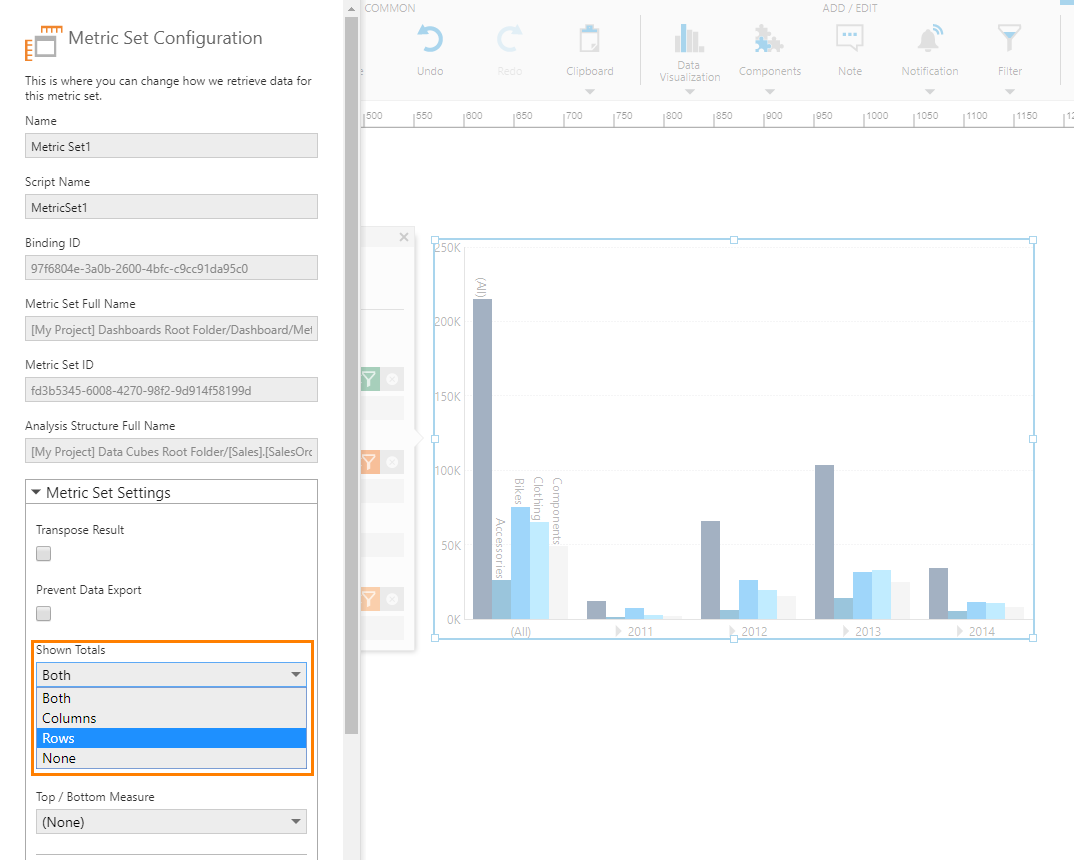
The overall total value and the grand total for each row (data point) are not displayed anymore, only the grand total for each Product. This makes it easier to compare values in the chart.
3. Show grand total for a pie or waterfall chart
Pie charts and waterfall charts are handled a bit differently because they already typically display total values, except for grand totals. You can enable or disable totals using only the metric set's settings, and totals are usually enabled by default.
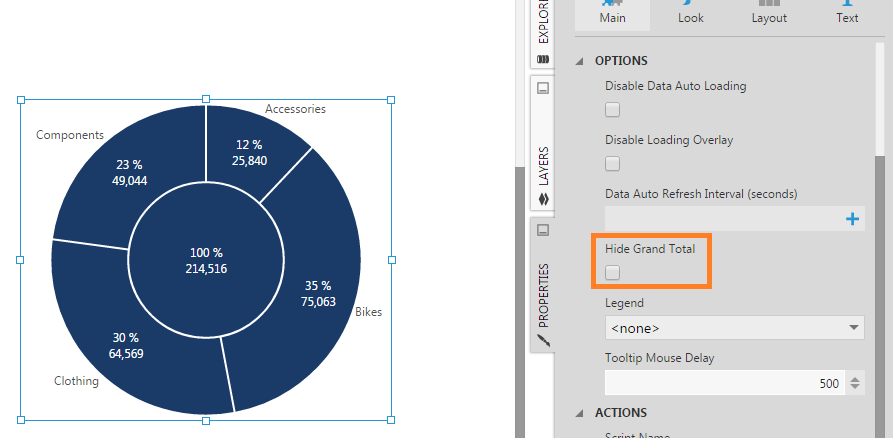
For these charts, uncheck their Hide Grand Total property in the Properties window, located under Data Points in recent versions, if you want to see the grand total value. This is displayed at the center of a pie chart, for example.