
1. Overview
Edit, View, and Sandbox View are the options you see in the toolbar of a dashboard, report, or other type of view, depending on which mode you are currently in.
Related video: Dashboard Modes
2. Editing versus viewing
There is not much difference between editing and viewing except how mouse operations are interpreted and the options available in places like the toolbar.
In Edit mode, you can use your mouse or touchscreen to select content on the canvas, move it around, and resize it. Options are available to add and remove items, set up custom interactions, and change settings.
In View mode, visualizations and other content respond to mouse and touch interactions directly. This allows for you to view tooltips, click data to trigger a filter interaction that was set up, access the context menu to perform drilling down, interact with filter controls, etc. Additionally, reports, scorecards, and small multiples only execute and show repeated content while in View mode.
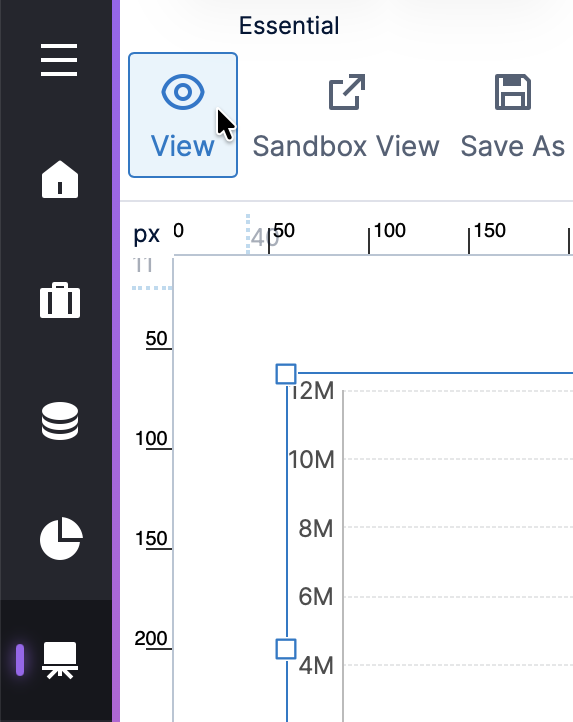
3. Sandbox view
The Sandbox View option is available in the toolbar when editing, and displays the current view in a new browser window or tab without any toolbars or docked panels, so that you won't mistakenly switch back to editing after making changes. You can use this to test changes in view mode while that view is checked out to you.
In most cases, changes that you make in the Sandbox View are not persisted/saved. The exception is when you are working with a checked-out metric set and make a change to how data is retrieved, for example by changing the sorting of some data using the context menu. A metric set encapsulates the data in a visualization and how it is selected. Changes to a checked-out metric set happen immediately, and are separate from changes to a dashboard and its view and edit modes. (Metric sets created directly on a dashboard are checked out together along with their dashboard, versus metric sets created first on their own.)
If you want to make sure all changes are not saved during viewing, you can check in the metric sets you are using beforehand, then use the Sandbox View option. Or, you can check in the dashboard.