
1. Overview
A treemap is a visualization that can display a large amount of hierarchical data using nested rectangles of varying size. The total area of a treemap normally reflects the sum of its parts, which consist of inner rectangles or nodes.
Treemaps have the ability to display a second measure as the color or shade of each rectangle.
2. Elements of a treemap
The figure below shows the main elements of a treemap data visualization.
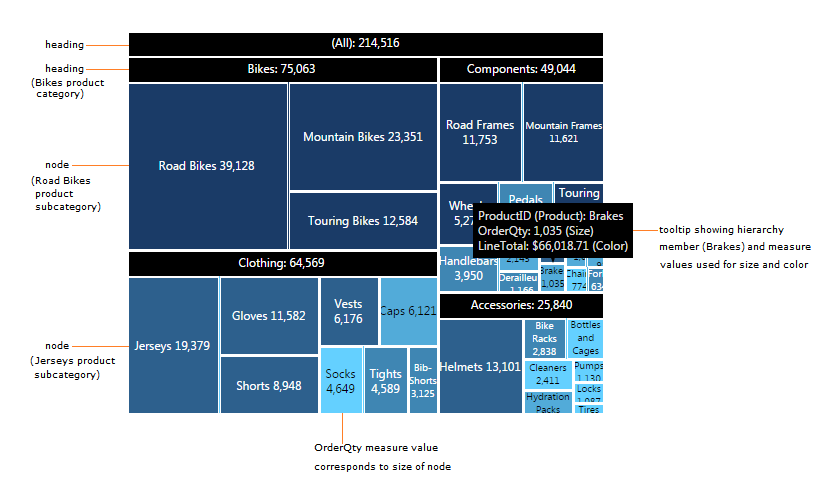
This example is configured with a Product hierarchy, and two measure values (OrderQty and LineTotal). The OrderQty measure is used to determine the size of each treemap rectangle and also displayed as text within each rectangle. The LineTotal measure is used to determine the color of each rectangle, where a darker shade of blue implies a higher LineTotal value for that rectangle in this case. Hover over or long-tap part of the treemap to view details about all of these values in a configurable tooltip.
Headings (seen here in black) group the rectangular nodes into multiple hierarchical levels: in this case, below the grand total (All) value at the top there are product category headings, below which are corresponding product subcategory rectangles/nodes. You can also display more levels than this, and you can drill down or expand portions of a treemap, as shown below.
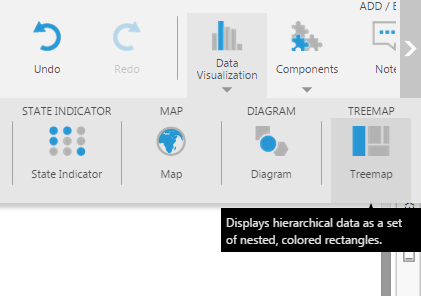
3. Choosing a treemap
When editing a metric set, dashboard, or another view, choose Treemap from the Data Visualization or Re-Visualize toolbar menu. It may also be recommended if your current data is a good match.
Select at least one measure (numeric data) and at least one hierarchy in your metric set to visualize as a treemap.
A measure will automatically be assigned as Size in the Data Analysis Panel's Visualization tab, but you can change this to another measure if preferred. This measure should use a Sum or Count aggregator.
4. Exploring data
Treemaps excel at visualizing the hierarchical grouping of data. You can explore and navigate hierarchical data interactively using a treemap.
4.1. Drilling down
When a multi-level hierarchy is selected, right click the Clothing rectangle and select Drill Down.
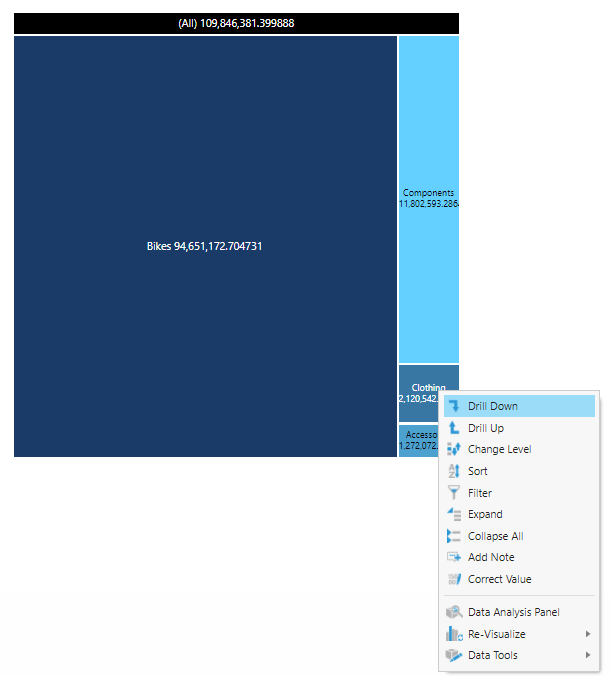
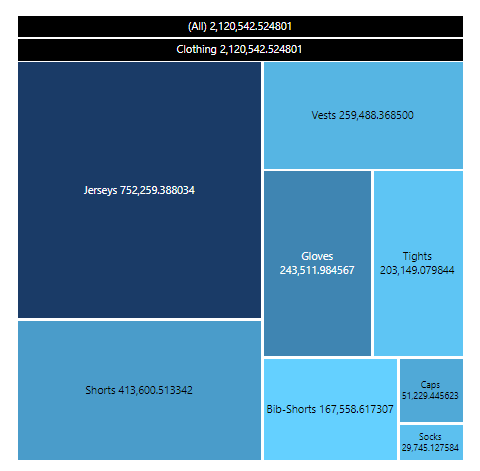
The treemap now shows a new heading corresponding to the Clothing product category, which is stacked below the All heading. The rectangles of the treemap now correspond to product subcategories of the Clothing category.
Right click the treemap and click Drill Up to go back to the previous view.
4.2. Change the hierarchy level
With a multi-level hierarchy, you can change the details level lower and view its data grouped by the upper levels of the hierarchy.
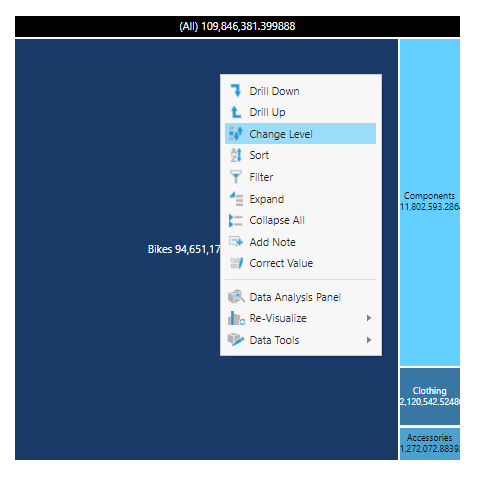
To change the displayed hierarchy level, right click the treemap, and then select Change Level.
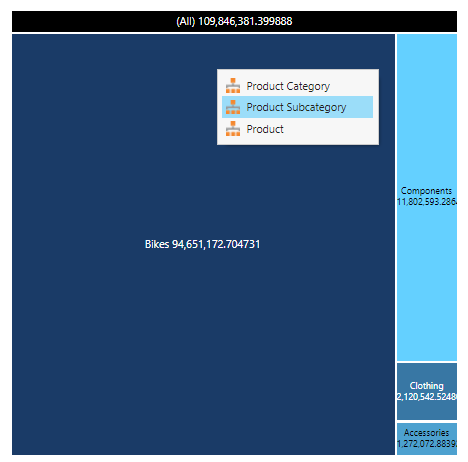
Select a hierarchy level from the submenu. For example, select Product Subcategory.
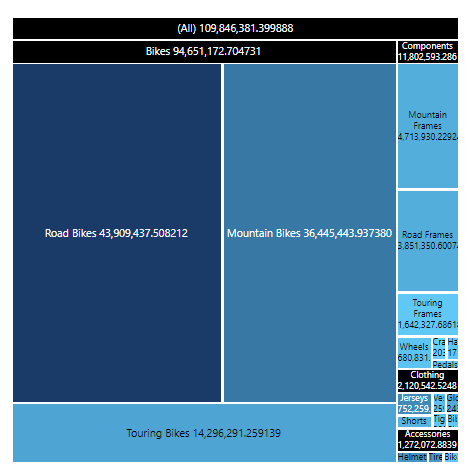
The treemap now displays all product subcategories in the form of rectangles that are grouped under their respective headings.
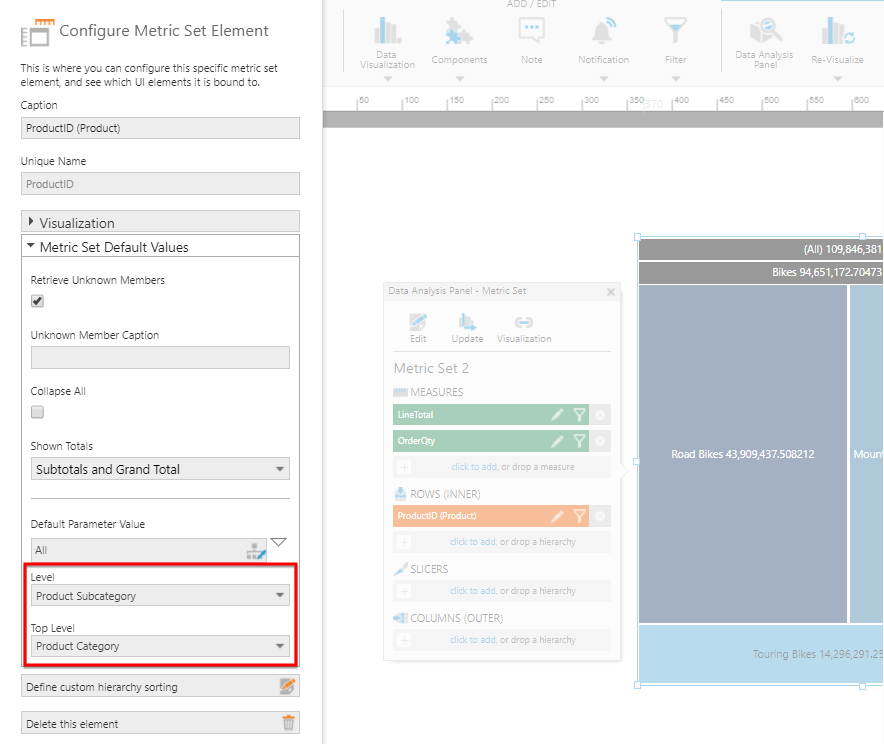
You can also change the level from the Data Analysis Panel by editing the hierarchy's settings.
4.3. Expanding and collapsing
When multiple hierarchies or a multi-level hierarchy is selected, you can right-click data and choose Expand to view that rectangle's data broken up into additional details, or Collapse to combine multiple values into a summary.
For details and examples with treemaps and other visualizations, see Expand and collapse hierarchy members.
5. Properties
This section describes some of the key properties of a treemap. Access these using the Properties window.
5.1. Color rules
The second measure added to a treemap is assigned automatically as Color in the Data Analysis Panel Visualization tab, or you can add a measure there yourself.
In the Properties window for a treemap, go to the Design (or Look) tab and expand the Color Rules section. You'll see the default Auto Color Rule item which you can click to view or edit.
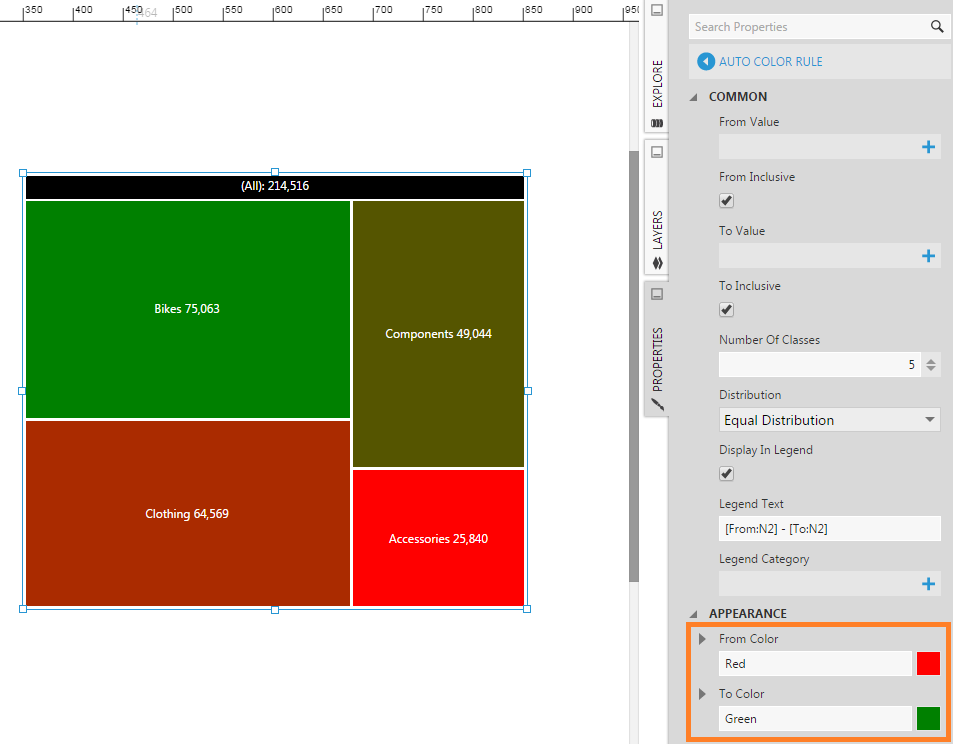
Use the From Color and To Color properties to set the range of colors for mapping to the measure values. You can choose to have colors ranging from red to green, for example, instead of using different shades of a single color.
There are also some more advanced properties in this section which allow you to set the Number of Classes (the number of different data ranges where each range is associated with a display/color value), and choose the Distribution method for assigning data points to the various classes. For more details on distribution methods, see Displaying symbols on a map.
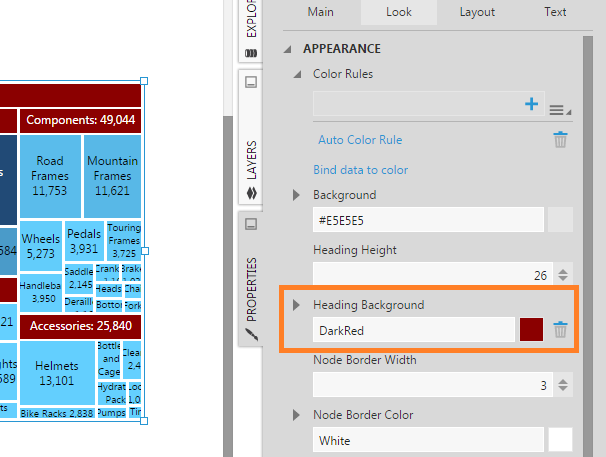
5.2. Heading background
In the Design tab, expand Lines & Fills (formerly the Look tab) to find the Heading Background property.
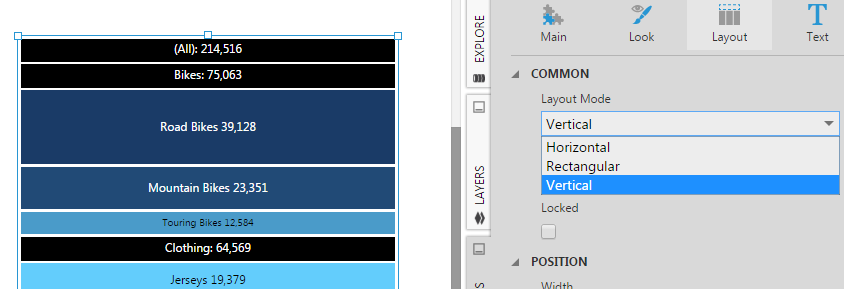
5.3. Layout mode
In the Design tab, expand Layout & Spacing (formerly the Layout tab) to find the Layout Mode property, which is set to Rectangular by default.
Rectangular is the most common option but you can change it to a Vertical or Horizontal layout instead to display a single row or column of rectangles of varying sizes.
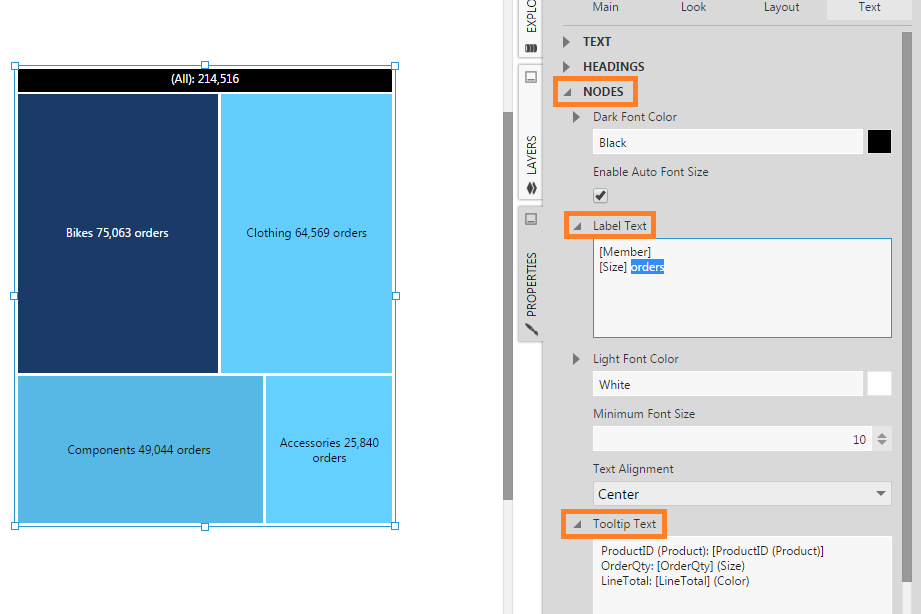
5.4. Label text and tooltip text
In the Design tab, expand Font & Text (formerly the Text tab) to customize the Label Text and Tooltip Text properties for either headings and/or rectangles.
These properties accept regular text as well as placeholder keywords for inserting the hierarchy member name, the value of the Size measure, and measure column values.
See Formatting text for details about supported keywords and formatting.
5.5. Selection
In the Design tab under Lines & Fills (formerly the Look tab), the Selected Style and Unselected Style determine how elements look when there is some treemap element selected.
Expand Font & Text to customize the selected and unselected text styling for headings and rectangles.
You can change how elements should become selected in version 24.2 and higher:
- Hover To Select – determines whether elements become selected while hovering over it with a mouse or long-tapping it.
- Click To Select – selects or de-selects an element when clicked or tapped.
In the Actions tab (Main tab in previous versions), you can set up interactions for Selected Data Changed. For example, add a filter action to automatically filter other visualizations based on the selected data rather than only whichever element was just clicked.
6. Notes
- Treemaps require totals from the measure used for sizing to represent rectangles correctly, so totals are enabled automatically for the metric set and its hierarchies and should be left enabled.
- The measure used to size treemap rectangles should be set to use a Sum or Count aggregator in the Data Analysis Panel, or in the OLAP cube when using an OLAP database. This is so that total values displayed for outer rectangles are the sum total of their contained values as viewers would expect, as well as to avoid potential performance issues with large datasets.