
1. Overview
This article shows you how to use the expand and collapse functionality to see more detailed breakdowns or step back to a summary view.
These options are introduced along with other functionality in the article Metric set analysis tools. Additional examples are shown here for tables, charts, and treemaps, and the same functionality is available for relationship diagrams, including the tree diagram.
2. Expand and collapse
Expanding a member is similar to drilling down in-place but without filtering out other members. In the same manner, collapsing a member is similar to drilling up in-place.
These options are available when selecting data using a multi-level hierarchy, or when multiple hierarchies are selected in the Data Analysis Panel.
2.1. Charts
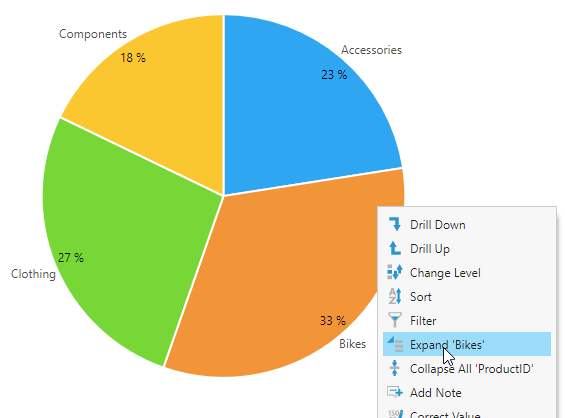
All chart types support the Expand & Collapse options, which are available when you right-click (or long-tap) a data point to open the context menu.
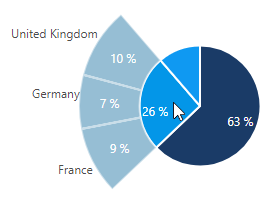
For example, right-click the Bikes member in this pie/sunburst chart, and then select Expand. (Switch to view mode on a dashboard first.)
The chart now shows an exploded view of that member but the other members are not filtered out. They are still displayed in order to provide context.
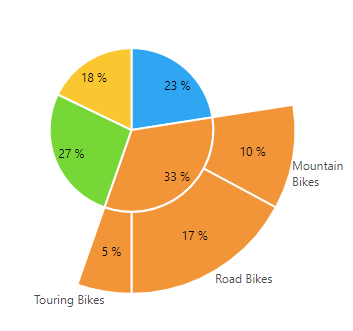
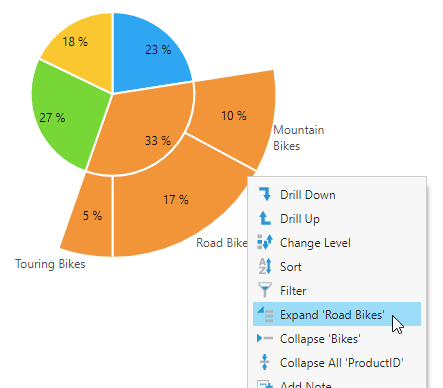
You can continue expanding members, or collapse members using the Collapse option.
Charts can also display expander buttons similar to those in tables when there is a categorical axis displayed.
2.2. Treemaps
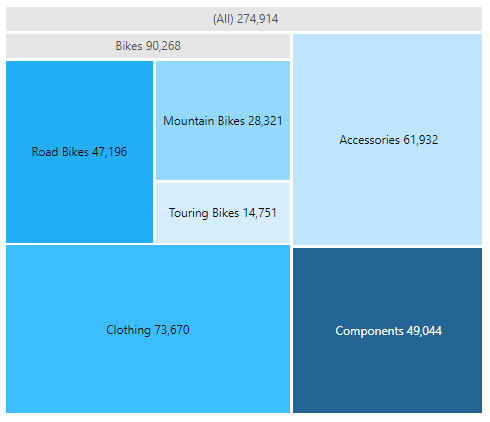
Expand and collapse works similarly for a treemap visualization. Just right-click a treemap rectangle and select Expand.
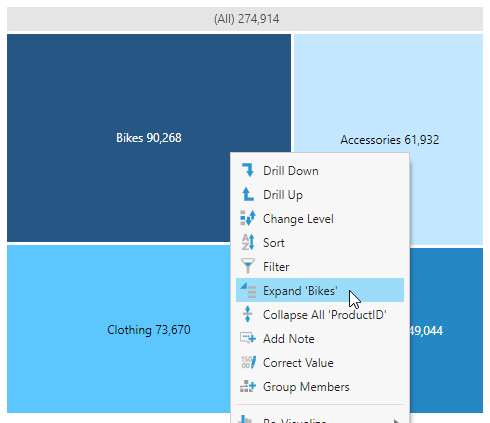
This breaks that value down into the next level's values while leaving the other rectangles unchanged.
You can right-click again and expand further, or click Collapse to go back to the original result.
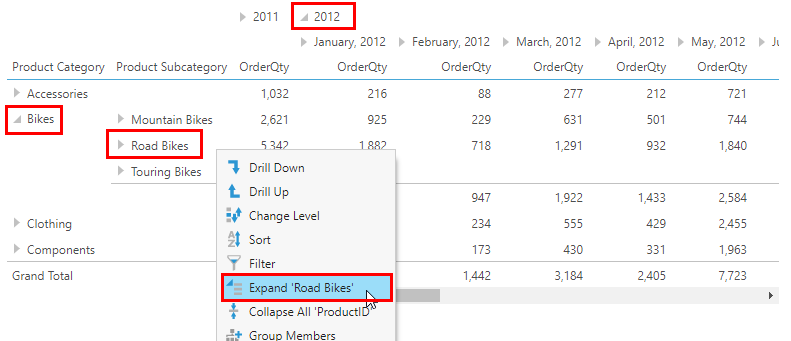
2.3. Tables
Table visualizations support expand and collapse functionality through the use of expander buttons (triangles) in row header and column header cells. These are toggle buttons that can be used to expand or collapse. Alternatively, you can right-click (or long-tap) a cell and use Expand or Collapse from the context menu.
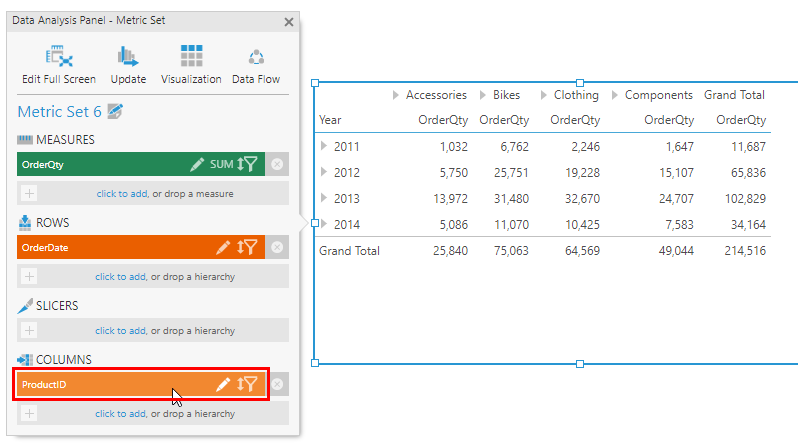
If you have a table visualization that displays plain columns or hierarchies with a single level, you can still see expander buttons in the leftmost columns.
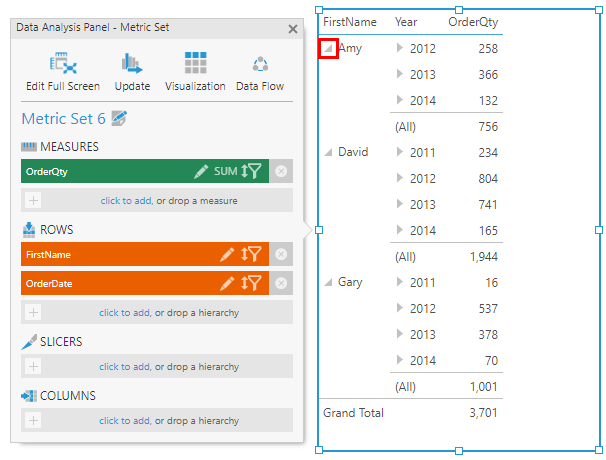
These expander buttons allow you to collapse the members below/to the right even though they belong to a separate hierarchy.
You can customize how or whether expander buttons are shown in the table's properties.
3. Expand/collapse on click
If you want to be able to simply click on data to expand or collapse it, you can easily set up this interaction for any visualization that supports expanding and collapsing.
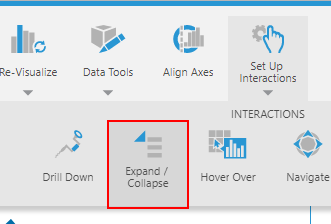
When editing a dashboard or another view with your metric set added, select the visualization and choose Set Up Interactions in the toolbar, then choose Expand / Collapse.
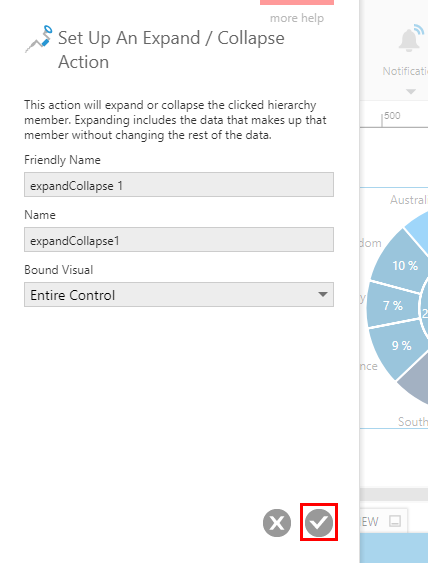
In the dialog that appears, you typically don't need to change any settings, and you can click the Submit button at the bottom to confirm.
Choose View in the toolbar, and click a data point. If there is data in a hierarchy or level below, it will be expanded; otherwise, it will be collapsed into the hierarchy or level above.
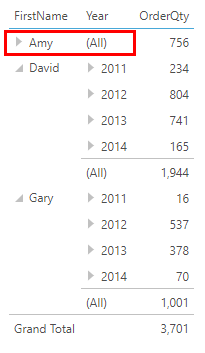
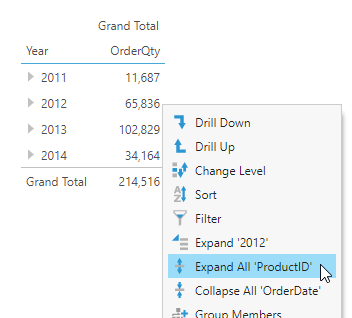
4. Collapse all
Every hierarchy has an All or Grand total value above the first level of the hierarchy. You can use the Collapse All option of the context menu to collapse all of the values of the hierarchy you clicked all the way up to this level. This can be used to leave out the details of that hierarchy and view the data broken down only by other hierarchy values.
When editing, you can also set a hierarchy to be collapsed this way initially, as follows:
From the Data Analysis Panel, edit the hierarchy.
Select the Collapse All checkbox.
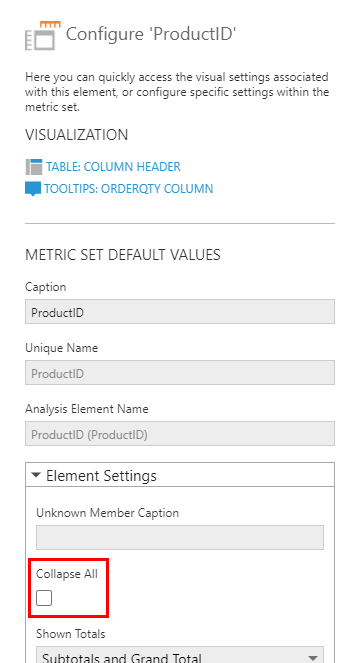
Click Submit. These values will now initially be collapsed to into a single All or Grand Total value. You or viewers can use the Expand All option from the context menu to view the individual values again.
5. Notes
- Expanding and collapsing requires the Change Data privilege. This can be disabled for users or groups, on the dashboard/view, or on the visualization.
- The Collapse All option may cause a pie chart to disappear if Hide Grand Total is selected in the chart properties. You will still be able to use Expand All from the context menu.
- Unknown indicates data outside of the hierarchy. This is not a member of the hierarchy and cannot be expanded. You can see data under Unknown by selecting an additional hierarchy or by changing the hierarchy level.
- Filters applied to the standard hierarchy will be ignored on the expanded members. The filtering will still be maintained on the aggregated hierarchy levels.