The SQL Select transform is created when a structure is dragged onto the canvas from a data connector that supports relational queries. You can select the columns to be used in the data cube and set up aggregators. When retrieving data, these settings will then be translated into a SQL query and sent to the data source.
1. Input
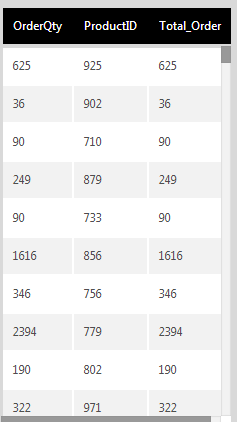
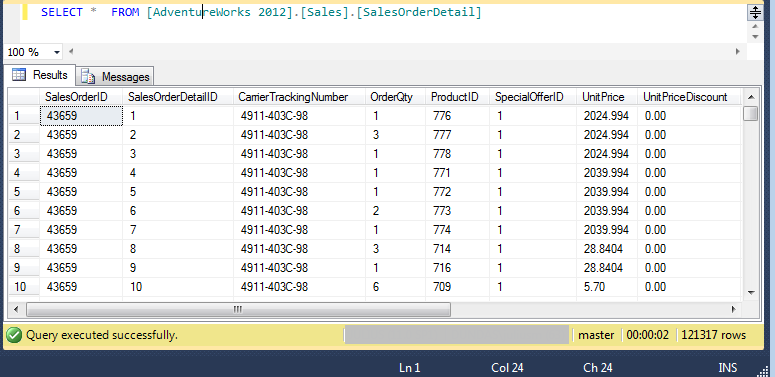
The structure of the table dropped on the data cube canvas is used as input. The examples in this article are based on the following data:
2. Add the transform
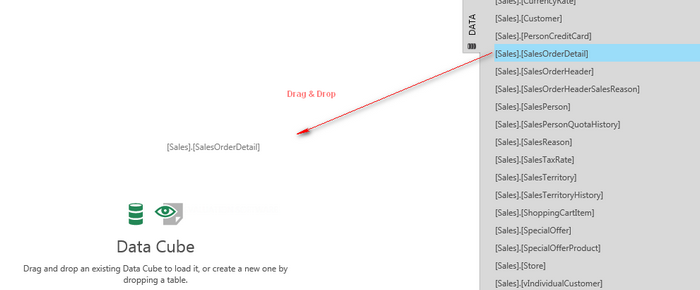
Expand the data connector in the Data Connectors folder in the Explore window, then drag a structure (e.g., table or view) to the canvas.
3. Configure
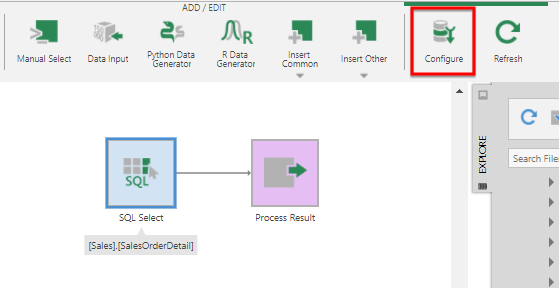
To configure the transform, double-click it, or select it and click Configure in the toolbar.
The SQL Select configuration dialog appears with a list of the available input elements.
Use the checkbox next to each element to select which ones should be included in the transform's output.
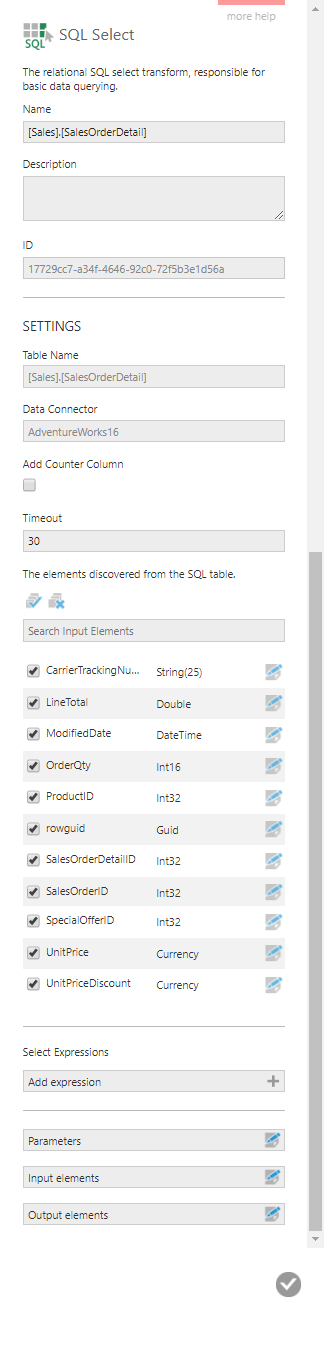
Enabling the Add Counter Column option will group by the values in each existing column and add a new column containing the corresponding number of records for each set of values.
The Timeout (in seconds) can be customized to determine how long to wait before terminating a long-running database command.
3.1. Transform element
Click the Edit icon next to a column name to configure it and access different options that may be available depending on the data type and data provider.
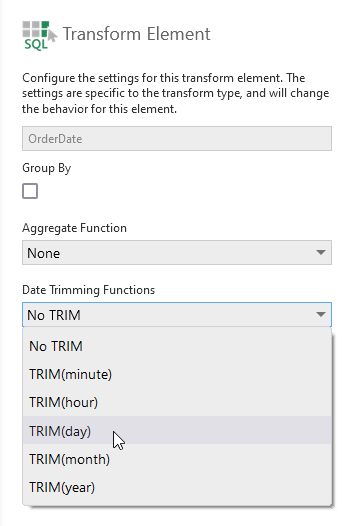
The list of available Aggregate Function options reflects the functions supported by the data provider. For example, numeric columns from SQL Server support STDEV, STDEVP, VAR, and VARP in addition to the built-in aggregate functions.
There may also be Date Trimming Functions available for date/time data. For example, these can be used along with the Group By & Aggregate Function options or an Aggregate transform to group by the selected time period.
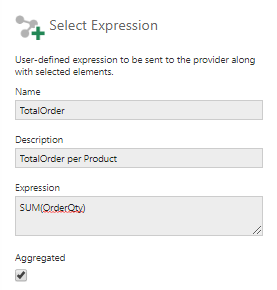
3.2. Add expression
Add a new element by inputting a provider expression.
You can also use a Scalar-Valued function in the Expression:
dbo.ISOweek(DATEADD(month,3,(ModifiedDate)))
In version 24.4 and higher, you can insert placeholders similar to those available for a Manual Select to insert values via parameters: include a name in your expression enclosed by dollar signs ($), and click Placeholders to set up the corresponding parameter with a matching Identifier. For more details on adding and configuring the placeholder, see Using manual select placeholders.
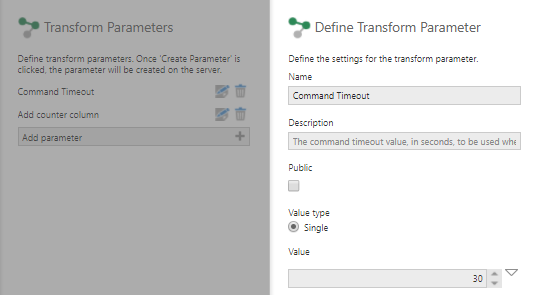
3.3. Define parameters
Parameters allow you to filter the data, or for transform options to be set from outside of the transform. The parameter's value can be changed by a bridge parameter in this data cube, or if you make the parameter public you can set it from outside the data cube, for example using a filter on a dashboard.
Click Parameters in the transform configuration dialog. In the Transform Parameters dialog that opens, click Add Parameter and select a parameter type:
- Transform Setting – Add a counter column or command timeout parameter to customize the configuration options above from outside the transform.
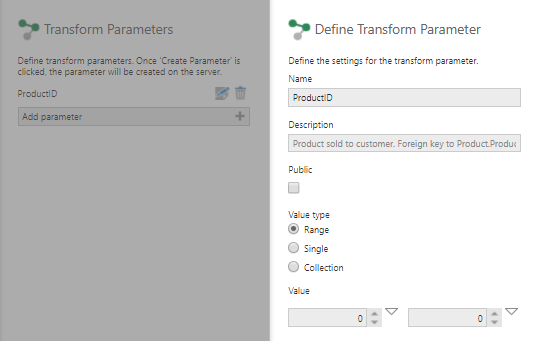
Transform setting parameter - Output Element Filter – Add a filter to a column in the transform.
Output element filter parameter TipThe token menu can be used to select options including attributes or custom attributes describing the logged-in user, or whether ranges are inclusive or exclusive. - Select Structure Parameter – Allows you to switch between multiple structures such as tables from the same data connector, provided they have the same column names and types (available in version 11 and higher). When creating this type of parameter, click to select which data structures (e.g., tables) are compatible and should be accepted as valid values, then this parameter can be set to the ID of the data structure you want to provide data. To find the structure's ID, find and expand its data connector in the Explore window to list its structures below, then right-click the structure and open its Properties dialog to find its ID field.
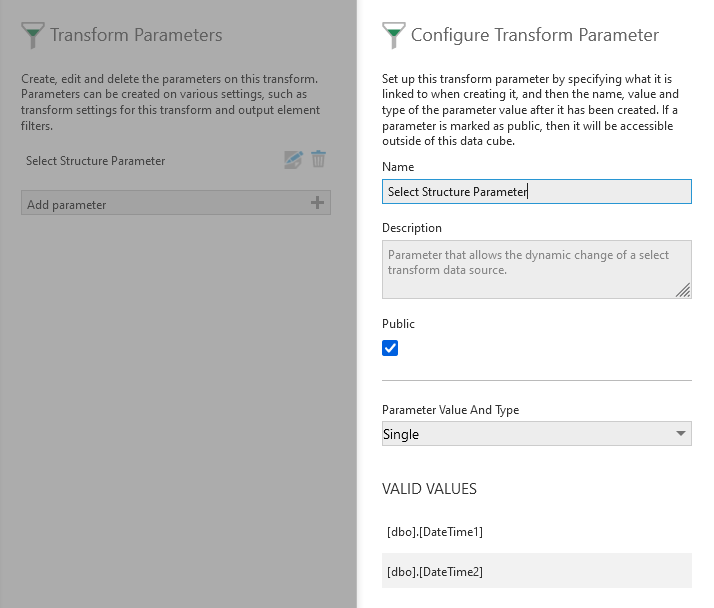
A select structure parameter with two available structures
When parameters are defined, a gear icon will appear in the corner of the transform when viewing the data cube process.
3.4. Edit input elements
This option in the configuration dialog allows you to change the source element behind each transform output element.
3.5. Edit output elements
Use this option to rename the output elements of this transform.
4. Output
Open the Data Preview window to view the transform output.