
1. Overview
This article shows you how to access performance measurements for retrieving and processing data.
2. For a metric set
You can view the performance measurements for the metric set behind any visualization, which is what provides its data.
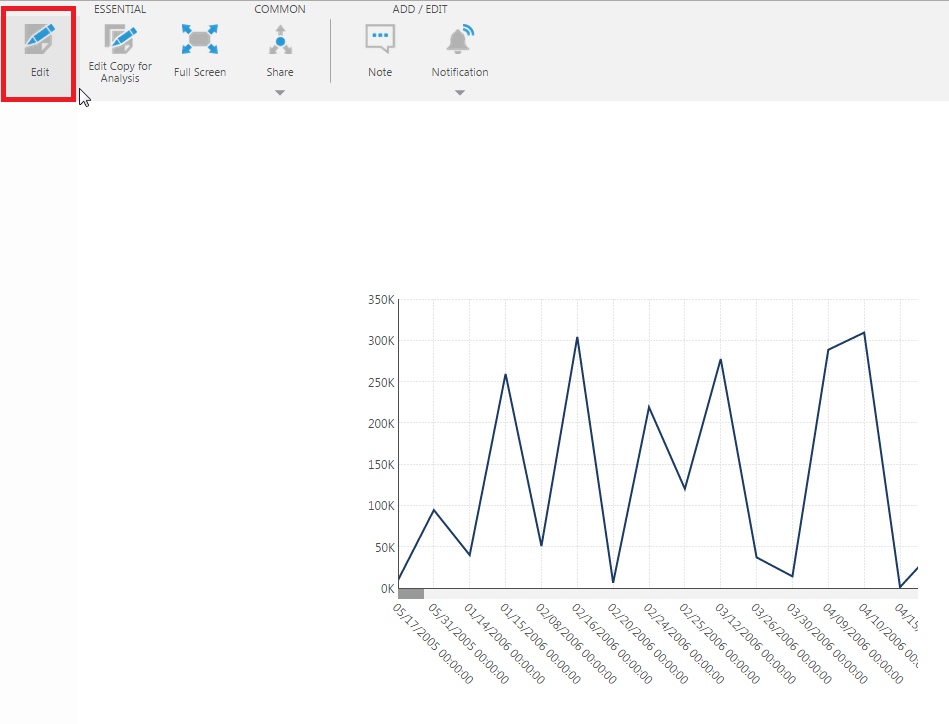
Open your dashboard or other view, and click Edit if you are currently viewing.
Select the data visualization for which you want to view the performance measurements.
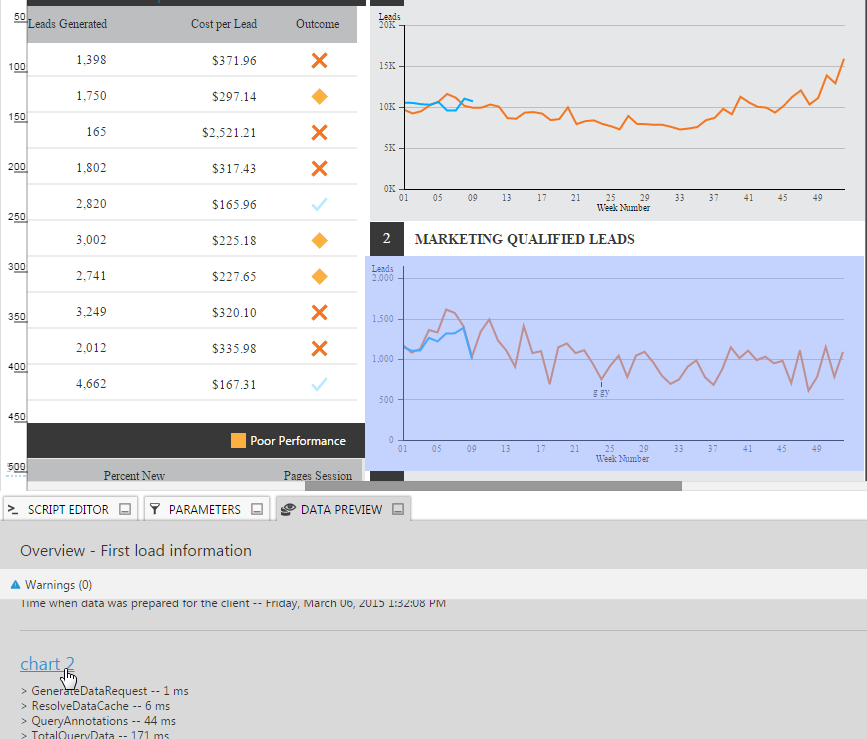
Open the Data Preview window, and select Performance Measurements.
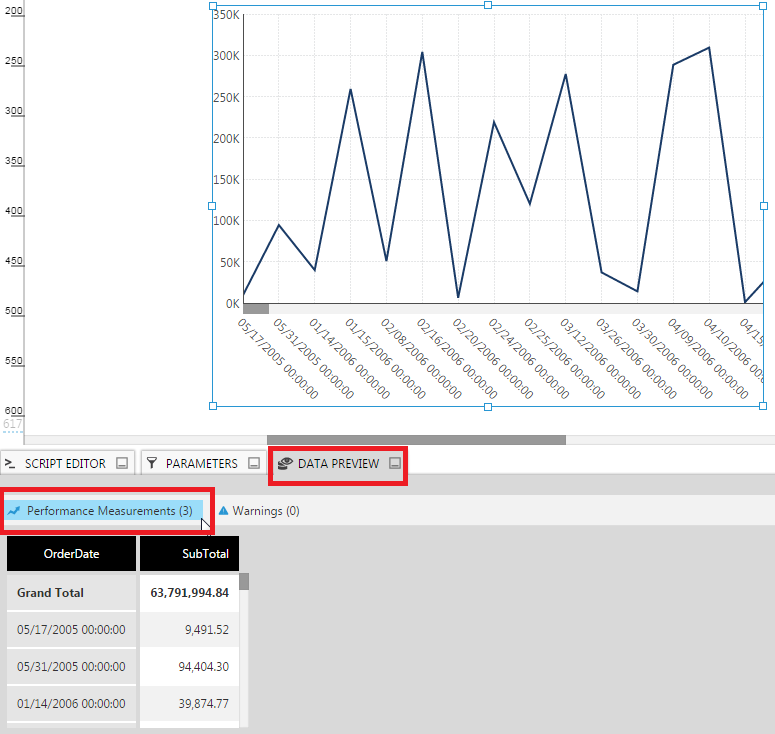
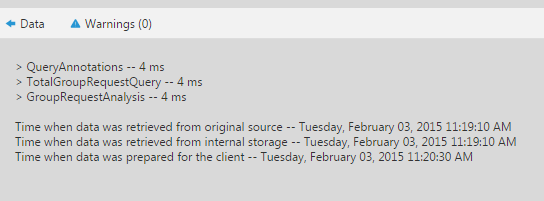
The performance measurements are shown in milliseconds, along with the times when the data was retrieved and prepared.
3. For a dashboard or view
You can view the overall performance measurements of a dashboard or other view including the data for all of its visualizations from when they first loaded, while you are either viewing or editing.
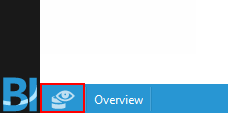
When viewing, find and open the Performance window, which may be minimized to the status bar and displaying only its icon.
If you are editing, you can click on the dashboard canvas to de-select all other controls, then click to open Data Preview.
The performance measurements from the first load will appear:
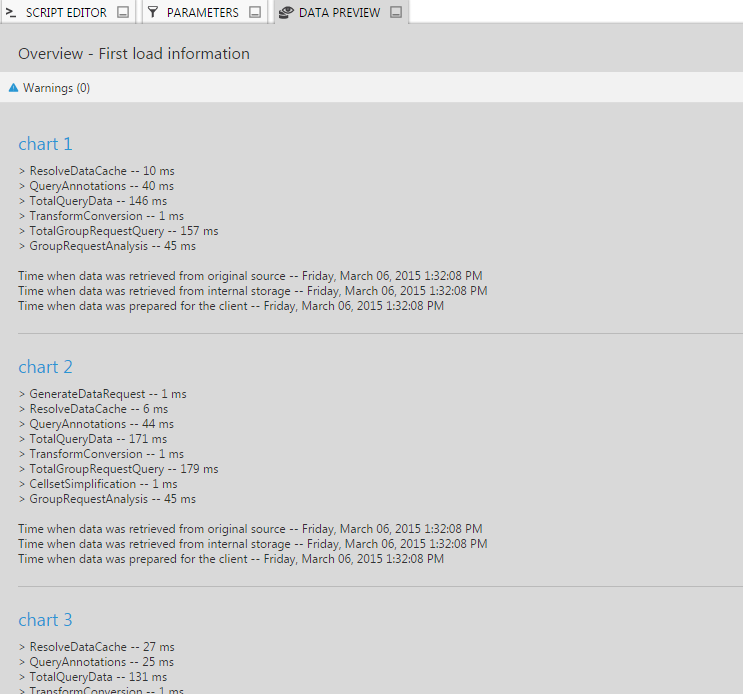
To know which data visualization corresponds to a performance measurement, click on the visualization name and it will be highlighted on the canvas.
4. Available performance measurements
|
Measurement |
Definition |
Description |
| CachingData | Data Caching | The time used to cache data and clone the cached result. |
| CellsetPagination | Cellset Pagination | The time used to perform cellset pagination. |
| CellsetSimplification | Cellset Simplification | The time used to perform cellset simplification for applicable data visualization controls. |
| CollapsingMembers | Collapsing Members Merge | The time used to collapse cells for the required collapsed members. |
| ColumnRowConversion | Cellset Result Conversion | The time used to convert a multi-dimension cellset to a standard column-row cellset result. |
| DrillDownAnalysis | Drill-down Analysis | The time used to perform drill down analysis. |
| ElementStatistics | Element Statistics | The time used to perform element statistics computations. |
| FormatMeasureValues | Measure Values Formatting | The time used to perform measure value formatting. |
| FormulaProcessing | Formula Metric Set Computations | The time used to perform formula metric set computations. |
| GenerateDataRequest | Data Requests Definition | The time used to generate the server data request. |
| GroupRequestAnalysis | Client Requests Analysis | The time used to analyze the client requests, perform parameter clean-up and request grouping optimizations. |
| HierarchySorting | Hierarchy Sorting | The time used to perform in-memory hierarchy sorting. |
| MeasureAnalysis | Measure Analysis | The time used to perform measure analysis for measure filtering and for script, missing data and state group computations. |
| MeasureComputations | Measure Computations | The time used to perform measure computations. |
| MeasureConversion | Provider Result Conversion | The time used to convert a provider column-row cellset to a multiple axis cellset. A bi-dimensional cellset is used internally that has column and row hierarchies only. However, a client cellset has measures attached to the column tuples (or row tuples if transposed). The conversion time is measured accordingly. |
| MeasureFiltering | Measure Filtering | The time used to perform measure filtering. |
| MeasureSorting | Measure Sorting | The time used to perform measure sorting. |
| MergeExpandedMembers | Expanded Member Merge | The time used to merge expanded members into the cellset result. |
| MergeParallelPeriod | Period-over-Period Merge | The time used to merge parallel period results with the main cellset result. |
| MergingAnnotations | Annotations Merge | The time used to merge annotations in the result. |
| MissingDataComputations | Missing Data Computations | The time used to perform missing data computations. |
| None | No Measurement Category | The measurements category has not been specified. |
| ParallelPeriodAnalysis | Period-over-Period Analysis | The time used to perform parallel period analysis. |
| ProviderAnalysis | Provider Analysis | The time used to perform provider query analysis and optimization. |
| QueryAnnotations | Annotations Query | The time used to query the data store for retrieving potential annotations for the current data result. |
| ResolveDataCache | Data Cache Resolution | The time used to resolve potential data caching results. |
| StateGroups | State Group Computations | The time used to perform computations for state groups. |
| TotalGroupRequestQuery | Total Group Request | The total time used to retrieve data for a group of compatible metric set requests (same metric set, same parameters, same overrides). |
| TotalQueryData | ETL Provider Engine | The total timing recorded between the end of provider analysis and the time the first record is successfully read from the ETL layer. |
| TotalQueryHypergraph | Hypergraph Engine | The total hypergraph query timing. |
| TotalQueryOlap | OLAP Engine | The total time used to query the OLAP engine. When an OLAP cube does the processing, this is recorded and potentially other measurements as well if additional conversion/processing is required. |
| TotalsComputations | Totals Computations | The time used to compute totals and the corresponding states. |
| TransformConversion | ETL Result Conversion | The time used to convert the provider result to a multiple axis cellset. |
5. Instance statistics
The load times for all your views and metric sets can be recorded for analysis. To easily view and analyze these statistics, you can install and use the Performance Tracking sample dashboard.