1. Overview
This sample shows how to integrate an external Javascript library, such as a Venn diagram library, into a specific Dundas BI dashboard using an HTML label.
The Venn diagram was first introduced in 1880 by John Venn, and is designed to show all possible logical relations between a finite collection of different sets.
If you prefer to add a custom visualization to the toolbar for Dundas BI users to add themselves to their own metric sets and dashboards without writing script, see Create a custom data visualization control.
2. Prerequisites
This sample requires:
- Basic knowledge of HTML, CSS and Javascript.
- Venn.js - A JavaScript library that can be used to draw Venn diagrams, based on the D3 library.
- dundasVennLib.js - A helper library that can create a Venn diagram in Dundas BI based on a metric set's data result.
- A user account with the Developer seat type in order to add custom script to a dashboard.
- Administrator access to Dundas BI and its server if you are adding the JavaScript and CSS to the instance as shown below.
3. Sample data
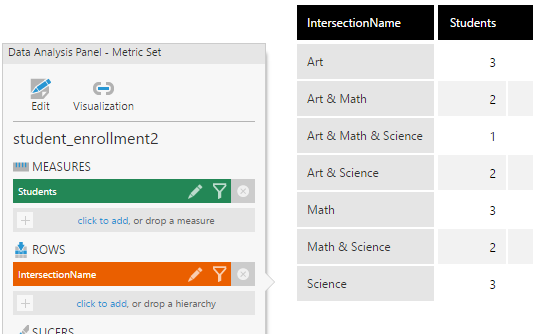
Create a metric set from the main menu, selecting the different category intersections on Rows and the member counts on Measures.
Disable totals from the toolbar or from the dialog shown when clicking the Edit button in the Data Analysis Panel.
A sample metric set looks like this:
4. Integrating Venn.js
The D3 library is already included in Dundas BI, but this example uses the D3-based Venn.js library, as well as a Dundas helper library to do most of the work of creating the Venn diagram and passing it data. The following steps show how to add these additional JavaScript libraries to your Dundas BI instance as well as CSS styling.
First, download and extract venn.js and dundasVennLib.js from the links in the prerequisites section above.
4.1. Version 9 and above
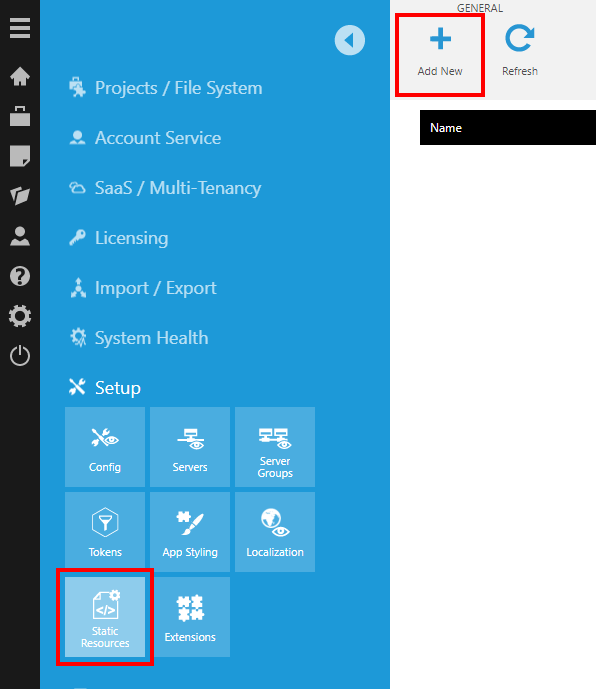
When logged onto Dundas BI as an administrator, access Administration from the main menu, click to expand Setup, and choose Static Resources.
For each file, click Add New in the toolbar, set Resource File Type to JavaScript file, and choose the file to upload.
URLs are listed next to each file that you can use to access them. In most cases, /api/ should be the first subpath or subfolder after the root of the website; if not, you may need to adjust the paths used to refer to these files below accordingly.
Next, navigate to App Styling from the blue sidebar on the left, and double-click or open the details for the HTML resource. Enter script elements like the following to include the JavaScript library files on each page in Dundas BI:
<script src="/api/resource/staticresourcefile/venn.js"></script>
<script src="/api/resource/staticresourcefile/dundasVennLib.js"></script>
Click to submit the dialog when finished.
4.2. Previous versions
Within the installed Dundas BI folder on the server, find or create a Dundas BI Javascript override folder located at [BIWebsite]/wwwroot/Scripts/Override, then add the JavaScript library files to this folder.
When logged into Dundas BI as an administrator, click Admin in the main menu, click to expand Setup and go to App Styling. Double-click or open the details for the HTML resource, then refer to the two JavaScript files above using <script> elements like the following:
<script src="/Scripts/Override/venn.js"></script>
<script src="/Scripts/Override/dundasVennLib.js"></script
5. CSS
Continuing from the App Styling page in administration, double-click or open the details for the CSS style resource, then paste in this CSS to format the tooltip displayed when hovering over the Venn diagram:
.venntooltip {
  position: absolute;
  text-align: center;
  width: 128px;
  height: 16px;
  background: #000;
  color: #FFF;
  padding: 2px;
  border: 0px;
  /*border-radius: 8px;*/
  opacity: 0;
  z-index: 10000;
}
For details on adding custom JavaScript and CSS to your Dundas BI instance as done above for this example, see White labeling the application.
6. Dashboard setup
When editing a dashboard, add an HTML Label component.
Under the Text properties of the HTML Label, add the following to the HTML Label Text:
<div id="venn"></div>
In the Properties window without any elements selected on your dashboard, find the Ready event under Actions, and add script to call window.dundasVennLib.generateVenn.
This script should be updated to refer to the ID of your own metric set created earlier, and the hierarchy and measures unique names from your metric set containing the data to visualize.
- You can find the metric set ID by right-clicking this file from the main menu or in the Explore window, choosing Properties, and locating the ID field. You can select its contents and press Ctrl+C or Γîÿ+C to copy it to the clipboard.
- When editing a metric set, you can confirm each hierarchy or measure unique name by clicking to edit it in the Data Analysis Panel, and checking the Unique Name field.
var div = d3.select("#venn");

var viewParameter1 = this.control.getViewParameterByName("viewParameter1"); // (optional, see below)

window.dundasVennLib.generateVenn(
    htmlLabel1, // the HTML label containing the div below
    div, // the Venn diagram container
    "2c344485-cad0-427b-bcec-9afd221d7eb2", // ID of the metric set providing the data
    "IntersectionName", // unique name of the hierarchy identifying the categories
    "Students" // unique name of the measure indicating the number of members of each category
    // [ // (optional) array of mappings between view parameters and metric set elements,
        // { // for when you want to use filters
        //     targetElementName: "<name_of_element_to_filter>",
        //     parameter: <view_parameter_used_to_filter_the_element>
        // }
    // ]
);
If you intend to use filters on the Venn diagram, you will need to add a script that refreshes the Venn diagram. This script can be added to the Parameter Value Changed event of those filters.
htmlLabel1.refreshVenn();
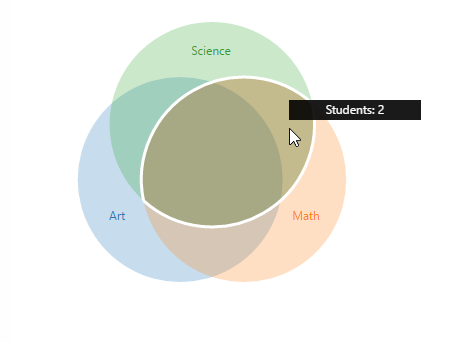
7. Result
The result of this sample is a Venn diagram that displays how many students are enrolled in the courses provided.