
1. Overview
This walkthrough shows you how to use interactions to allow viewers to show & hide content in dashboards and other views, which can include components, visualizations, and filters.
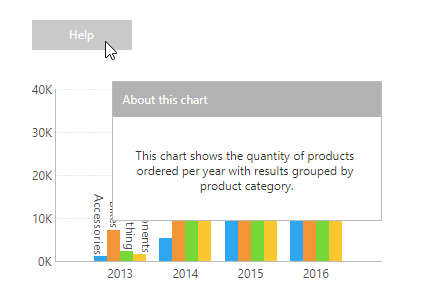
You could use this interaction to make elements appear like a pop-up or window. To show and hide multiple elements at once, you can group them into layers, then hide and show the entire layer. A basic interactive help overlay is added to a dashboard as an example below, which displays information about how to use a dashboard when a user hovers over or clicks on a help button.
Related video: Interactions
2. Create a new dashboard
In this example, we create a basic dashboard by dragging an existing metric set from the Explore window to the canvas.
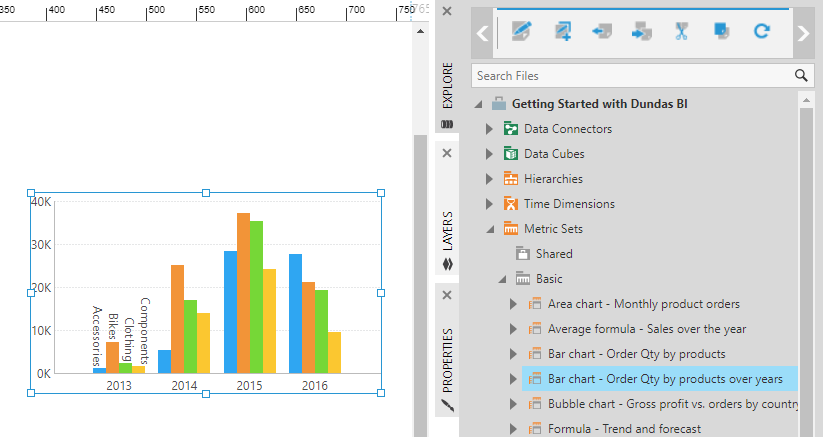
We have a bar chart in our example.
3. Create the help overlay layer
This example shows and hides multiple elements at once, so we will add them to a layer so we can easily show and hide all of them when viewing as well as when editing. Using multiple layers is optional.
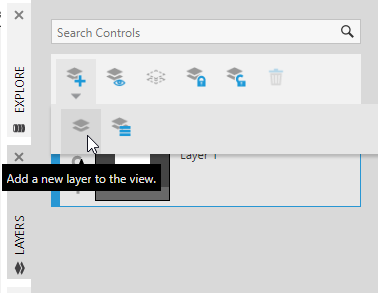
3.1. Add a new layer
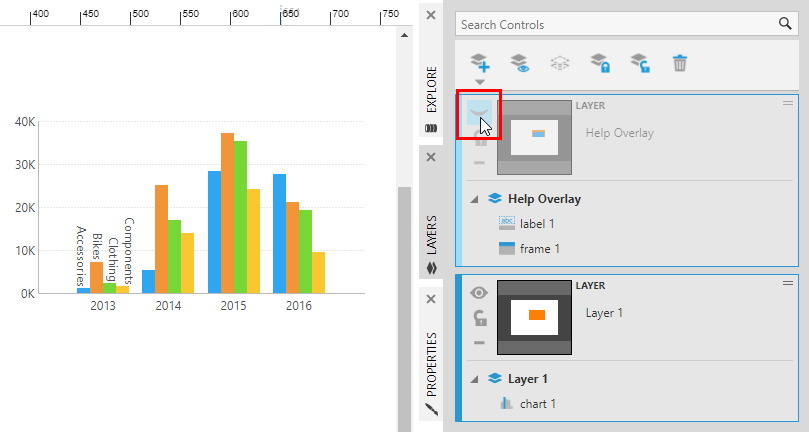
Open the Layers window and then click the toolbar button with the plus symbol to add a new layer.
If a submenu appears, choose the first icon to add a plain layer.
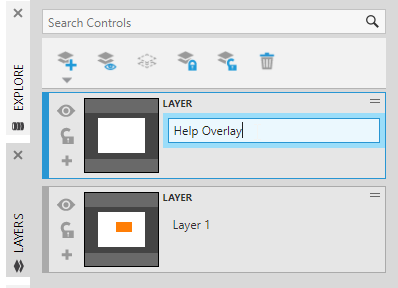
Layer 2 is added to the Layers window and becomes the current layer. This will contain help-related components such as a frame and a label.
Next, rename the layer by double-clicking its name or using the right-click option.
3.2. Add a frame component to the new layer
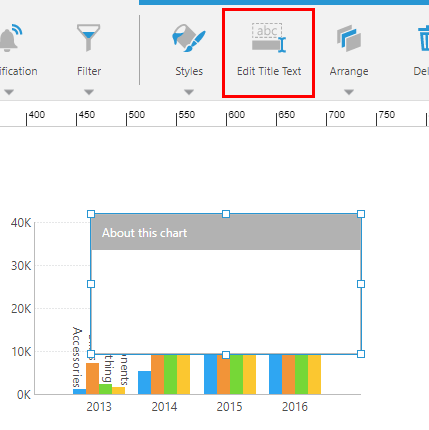
Click Components in the toolbar, scroll the submenu to the right, and choose Frame.
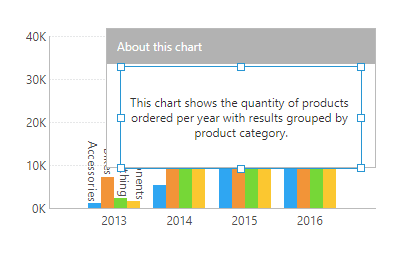
Position the frame component over the top-right corner of the bar chart.
In the toolbar, choose Edit Title Text and type in a new title for the frame such as About this chart. Press Enter or click away when finished typing.
3.3. Add a label on top of the frame
Go to the toolbar, click Components, and then click Label.
Position the label over the frame component, then double-click it or choose the toolbar option to edit its text, and type in a description.
3.4. Hide the help overlay layer
Initially, the help overlay layer should be hidden when viewing the dashboard.
In the Layers window, click the eye icon for the current layer (e.g., Help Overlay) in order to hide the layer.
If you want to show or hide elements individually without creating a layer, you can similarly use the Layers window to right-click each one and hide it so that it's initially hidden when viewing.
4. Add a help button
Now that the help overlay layer is completed, make sure the first layer is the current one in the Layers window by clicking to select Layer 1.
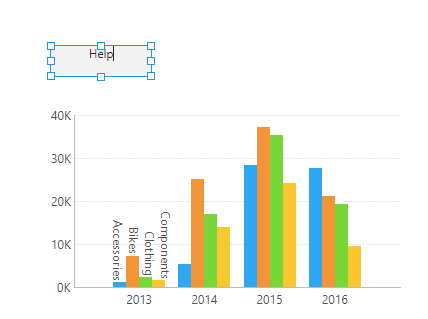
In the toolbar, click Components and choose Button.
Double-click the button or choose the toolbar option to edit its text, and type the new button text as Help.
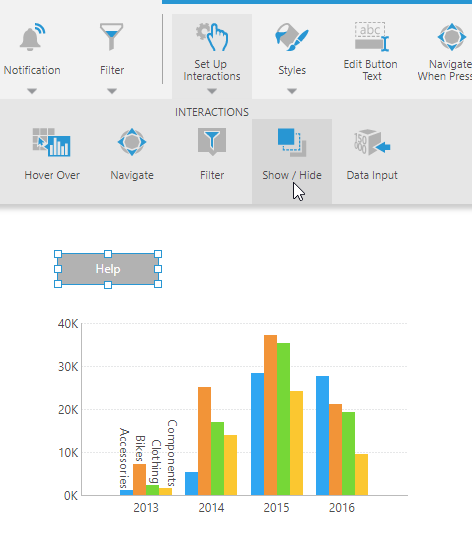
4.1. Set up the show / hide interaction
Click Set Up Interactions in the toolbar, then choose Show / Hide. (This is also known as Change Layer and it is labeled this way in earlier versions.)
In the Set Up A Show / Hide Action dialog, you can select a layer under Show Layers to be shown. To show one or more elements individually instead of an entire layer, click to expand Controls and select elements under Show Controls.
When showing a layer or control, you may want to set up a separate interaction to hide the same content later. For example, viewers could click on the layer's content to hide it again, or you could add a separate close button.
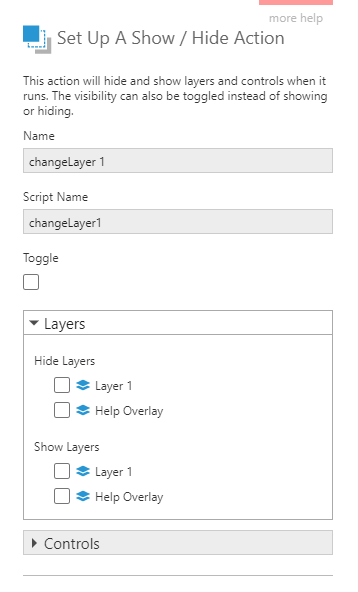
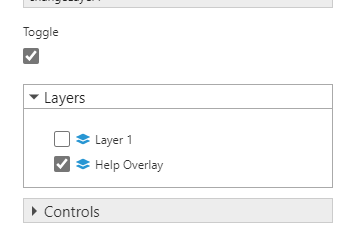
To use a single button both to show and then hide content, click to enable the Toggle checkbox option, then click to select the items to alternate between shown & hidden (e.g., the Help Overlay layer).
Click the submit button at the bottom of the dialog to finish setting up your interaction for button clicks.
5. Test the help overlay
To test your interaction, click Sandbox View in the toolbar to view the dashboard in a new browser tab, and then click your Help button.
6. Scripting layers
Change layer actions can be used to show, hide, or toggle layers from any built-in event, but if you need to trigger the same action from your own script instead, you can use JavaScript like the following:
var canvasService = this.getService("CanvasService");
var helpLayer = canvasService.getLayersByFriendlyName("Help Overlay Layer")[0];
// var helpLayer = this.baseViewService.currentView.control.layers[1];
if (helpLayer.hidden)
    canvasService.showLayers([helpLayer]);
else
    canvasService.hideLayers([helpLayer]);
This script gets the layer by its display name like the one assigned to the layer in this article's example, or you can get it by index as indicated in the commented-out code.