
1. Overview
This article shows you how to use #TRACE statements in server-side DundasScript such as the ones used in calculated element transforms. The output from #TRACE statements goes to the application logs which can help you to debug your scripts.
DundasScript is used in several areas of the application, including:
- Data connectors (Generic Web, OLAP)
- Tokens
- Formulas
- Transforms (e.g., Calculated Element)
- Bridge Parameters
2. TRACE statements
You can insert a #TRACE statement as a line of script anywhere DundasScript is used:
#TRACE <value to output>;

// Optionally pass any number of values separated by commas:
#TRACE <value 1>, <value 2>, <value 3>;
3. Using #TRACE with a Calculated Element transform
For this example, create a new data cube and drag the [Production].[Product] table from a data connector in Explore to the canvas.
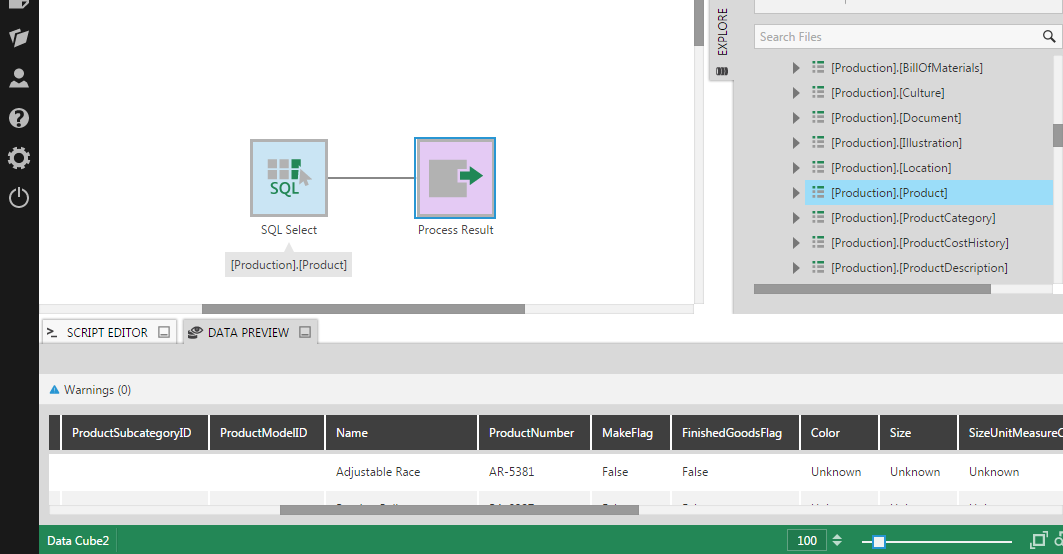
Select the connection link between the two transforms, go to the toolbar, click Insert Common, and then click Calculated Element.
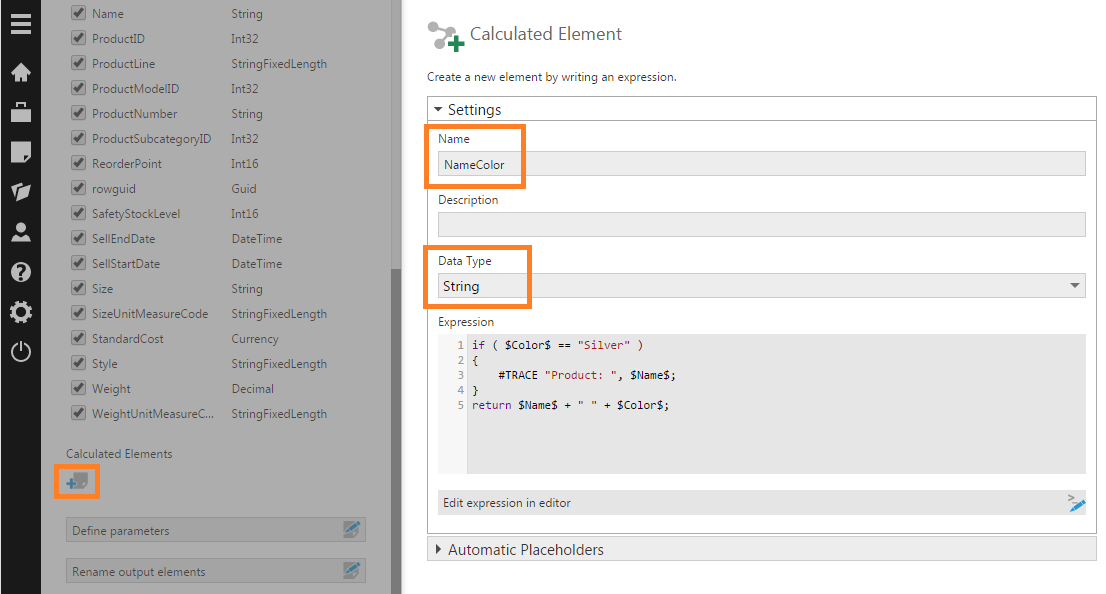
Double-click the Calculated Element transform to configure it. In the configuration dialog, scroll down and click the plus button under Calculated Elements to add a new calculated element (i.e., a new output column which will be defined using a script).
Enter the Name of the calculated element, set its Data Type to String, and then type in the following Expression (script).
if ( $Color$ == "Silver" )
{
    #TRACE "Product: ", $Name$;
}
return $Name$ + " " + $Color$;
This script creates a new output column by concatenating two existing string columns. It also outputs a #TRACE statement to the application logs in administration for each product that has a Silver color.
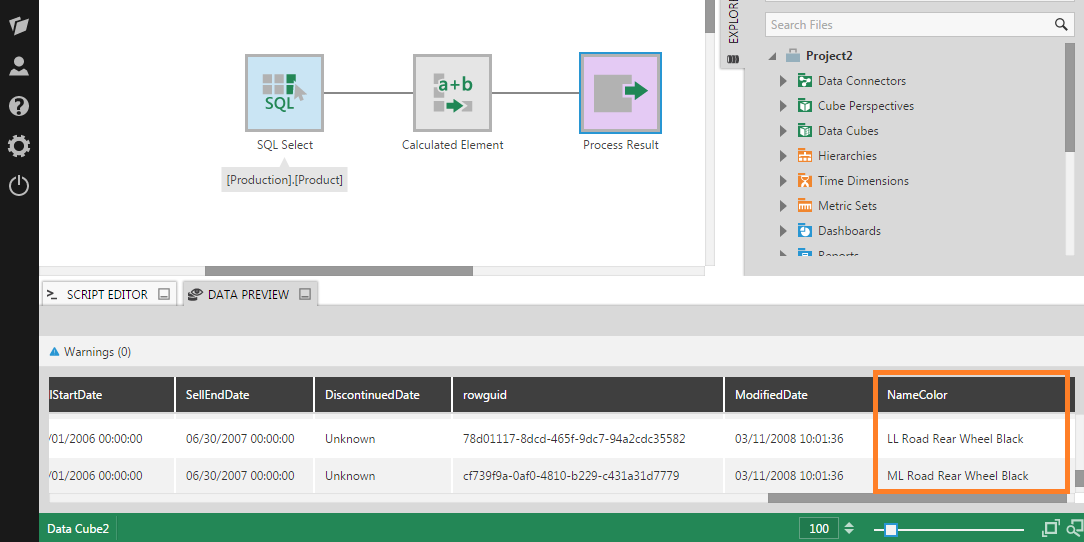
Select the Process Result transform on the canvas and then click Data Preview to see the output from the data cube.
4. Viewing the output
Finally, if you're an administrator, go to the Logs screen to see the output of the #TRACE statements that ran when the script executed. Double-click an entry or select it and click Details in the toolbar to view its complete message.
You'll see some information about where the script was executed, the line number of the #TRACE statement in the script (helpful if you have multiple such statements), and lastly the actual output of the #TRACE statement itself. For example:
DataCube: [Production].[Product] Data Cube
Location: /Projects Root/Adventure Works/DataCubesRootFolder
Transform Name:
Transform Type: Calculated Element
Connector Element: Derived Column Output
Element Name: NameColor
(ln:3) Product: Mountain-500 Silver, 52