
1. Overview
A contextual measure lets you enter your own values to augment existing data in your metric set. Contextual measures are part of the metric set and you can enter or change contextual measure values when it is checked out to you.
Different values can be entered and displayed if you have multi-level hierarchies or slicer filters.
2. Adding a contextual measure
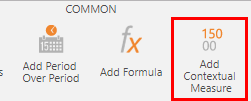
With the metric set checked out to you, click Add Contextual Measure in the toolbar. (When editing a dashboard or another view, you can find this option within Data Tools in the toolbar.)
Alternatively, you can click to add in the Data Analysis Panel and select Contextual Measure.
A Measure Value bar appears. For a single value that applies to every row or column (e.g., every sales person), enter it and click apply.

To enter different values for each row or column, click multiple at the far right of the measure value bar instead.

This opens the Data Preview window with editable fields for your contextual measure.
Click inside a field and type a value. You can type Enter on your keyboard to finish entering a value and move to the next row (or Tab to move to the next column if the metric set is transposed).
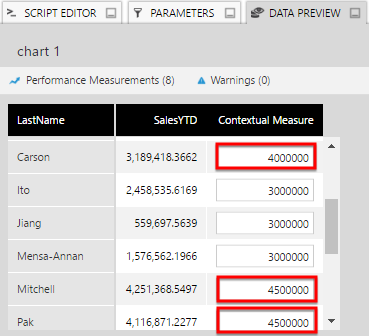
Values you enter for a specific row or column will take precedence over a single value entered into the measure value bar, if you have entered both.
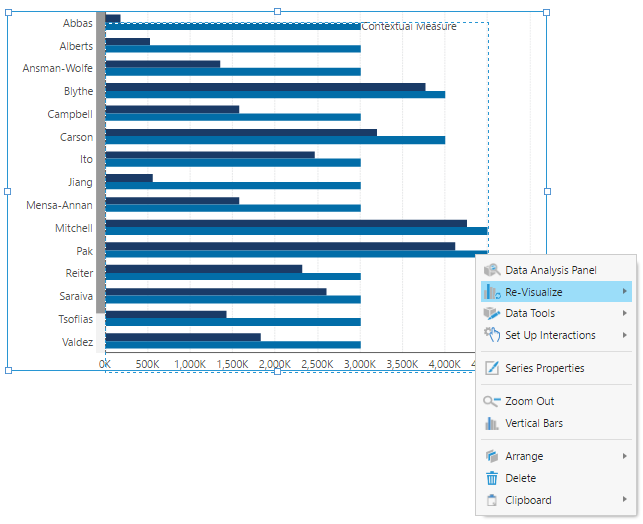
In a chart or table, you might now choose to change how the new measure is visualized, for example by right-clicking it and using the Re-Visualize option.
3. Editing the measure values
To enter or change values after the contextual measure was already added, click the number icon shown for the measure in the Data Analysis Panel.
This re-opens the measure value bar, where you can enter or change the single value here, or click multiple to change or enter values for each row or column.
Alternatively, you can right-click (or long-tap) a single value in the visualization and choose Change Value. (When editing a dashboard or another view, first choose View to interact with data in the visualization. The metric set must still be checked out to you to edit the contextual measure values directly.)
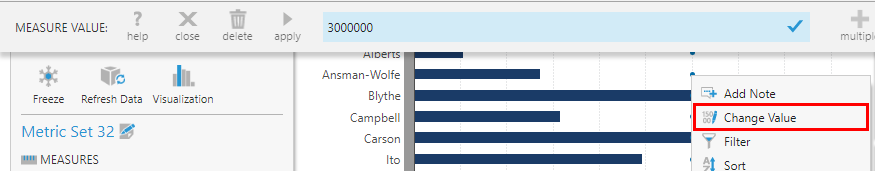
This opens the measure value bar for a specific value, where you can enter a new value for this specific row or column, or click delete to remove a value you previously entered.
4. Different contexts
To allow appropriate values to be displayed for different contexts, the values you enter apply for whatever the current level of each hierarchy is and whatever the slicer filtering is on the metric set.
To enter values that will apply at other levels of the hierarchy, you can right-click (or long-tap) the visualization and choose Change Level.
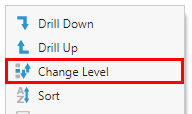
Now you can re-open the measure value bar as described above to enter a value for this level. For example, you can change the level from Year to Month and enter a monthly goal that is different from your yearly goal.
All values you enter are saved, and will be displayed later when the level is changed back.
Similarly, you can filter any hierarchies placed on Slicers in the Data Analysis Panel and enter a different value into the measure value bar.
5. Notes
- When working with hierarchies, the values you provide are applied only to the current level. These values will not be distributed to lower hierarchy levels or aggregated into higher hierarchy levels. The highest-level values (for example Years) will be the only ones contributing to the Grand Total.
- When entering values for different hierarchy levels or filtering, the metric set settings are used when storing the values. When editing a metric set on a dashboard with filters attached, you can change these settings by opening the hierarchy's settings dialog from the Data Analysis Panel, or by editing the metric set full-screen.
- Contextual measure data is not affected by the check in or check out state of the metric set. Undo Check Out does not change or remove data.