
1. Overview
This article shows you how to display data from a Microsoft Excel file using simple drag-and-drop operations. This also works for other file data sources such as Access, flat files such as CSV, or XML files.
2. Drag an Excel file to the Explore window
This example depicts these steps followed after creating a new metric set from the main menu, but you can follow the same steps when editing a dashboard.
Locate your Excel file on your device (e.g., Windows Explorer or Finder), then drag and drop it into the Explore window.
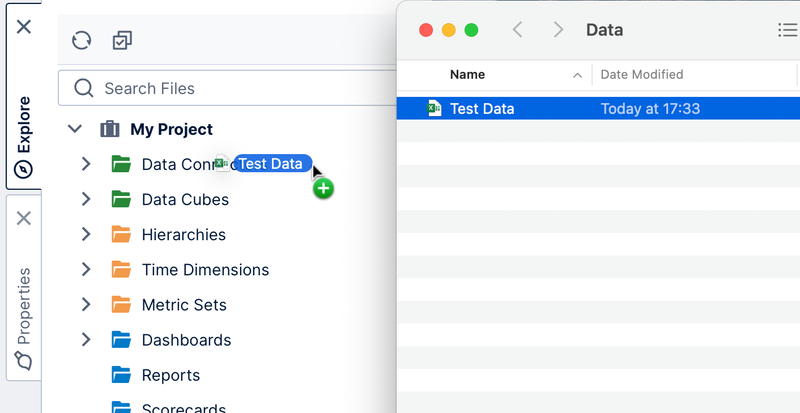
The Excel file is automatically imported as a data connector.
Expand the Data Connectors folder in the Explore window to see the auto-generated data connector for the Excel file. You can further expand the data connector to see any sheets and tables found in the file, and the column structure of each sheet.
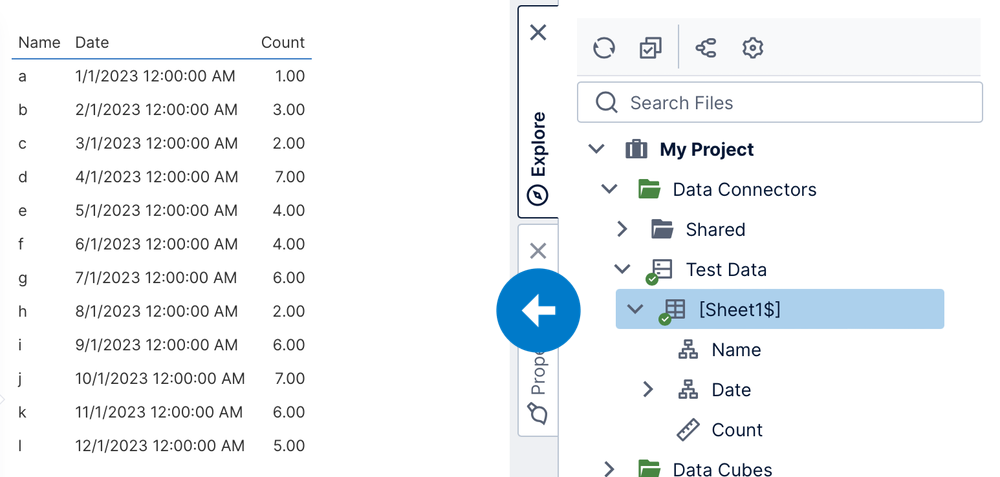
For this example, drag an Excel sheet from the Explore window to the canvas to view its entire contents. A table visualization appears which displays the contents of the Excel sheet.
Alternatively, you can also drag individual columns one at a time that you want displayed.
3. Drag an Excel file directly to the canvas
Optionally, you can drag an Excel file from your computer and drop it directly onto a new metric set or onto the canvas of the dashboard when editing.
The Excel file will be added as a data connector in the Explore window the same way as shown above, and a table visualization will automatically appear on the canvas displaying data from one of the file's sheets.
4. Remove a column from the table
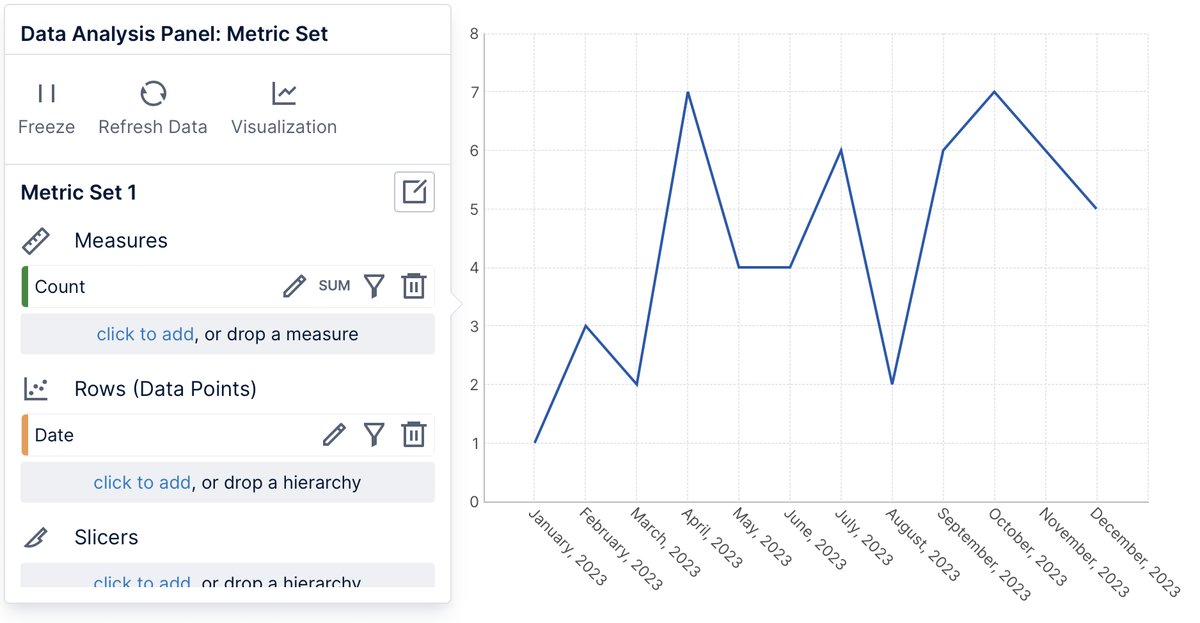
The Data Analysis Panel normally appears automatically to the left (if not already open when editing a dashboard, select Data Analysis Panel in the toolbar or from the right-click menu).
For this example, we are not using the Name column. Click the icon to remove it from the metric set so it is no longer displayed.
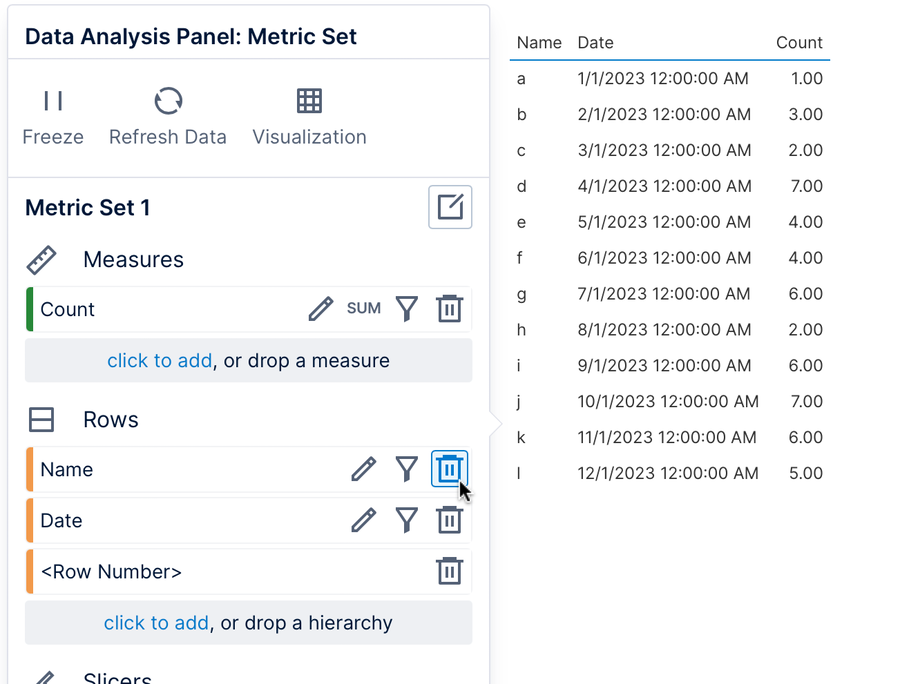
A different visualization may be chosen automatically for you (e.g., a line chart) based on the remaining data using its recommendation engine if you didn't choose a specific visualization yourself. You can always choose your own preferred visualization as shown later.
5. Replace date column with time hierarchy level
Expand the Time Dimensions folder in the Explore window. (When following these steps differently, click the suitcase icon in the toolbar of the Explore window first if it's showing a simplified view of items without a Time Dimensions folder.)
Expand the default time dimension and also its hierarchy that contains Month.
Drag the Month level of the hierarchy and drop it onto your existing date column in the Data Analysis Panel.
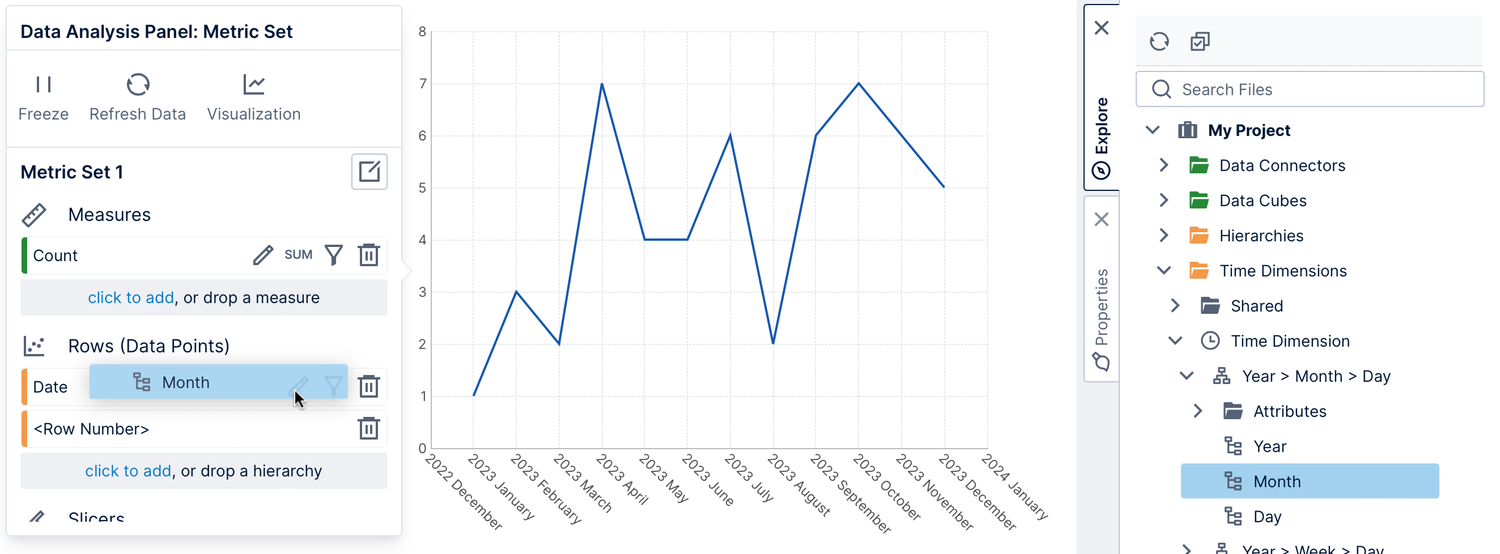
The visualization is updated to group the dates into months and display the month names.
6. Re-visualize
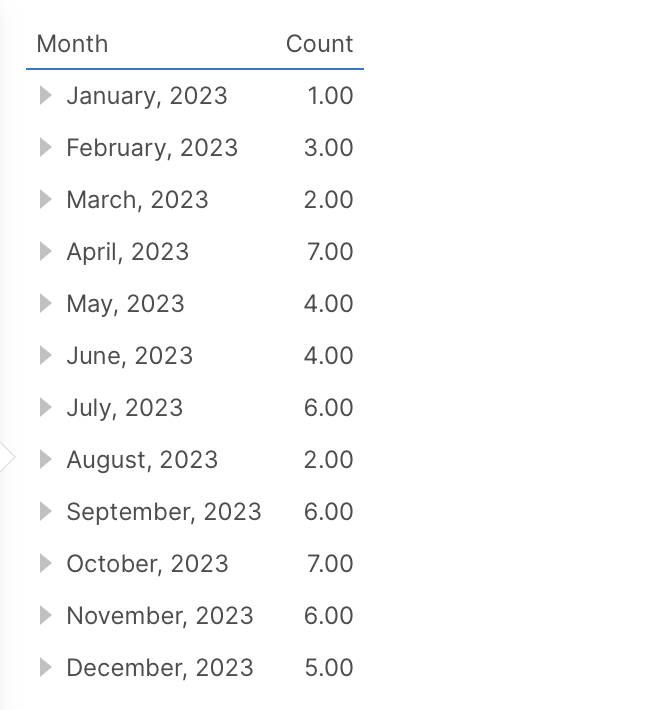
Finally, click Re-Visualize from the toolbar, and then choose a different visualization if you prefer.
In our example, the we can switch back to a Table from the line chart.
7. Notes
Dragging and dropping a file to the application will upload the file.
- For updates to the file to take effect, you must either edit the data connector and upload a new file, or specify a URL or path to access the file in the data connector settings. See Connecting to Excel for more information.
- An uploaded file will be automatically warehoused after the first use to improve performance.
- You can download an uploaded file. Right-click the checked-in data connector from the Explore window or main menu and select Download File.