
Dundas BI is now the Managed Dashboards & Reports module of Logi Symphony, a state-of-the-art embeddable business intelligence platform for data exploration, visual analytics, and creating & sharing dashboards, reports, and more. You can deploy it as the central data portal for your organization, or integrate it into an existing website as part of a custom or embedded BI solution. It is flexible enough to adapt to your needs and to every type of user.
Related video: Dundas BI Overview
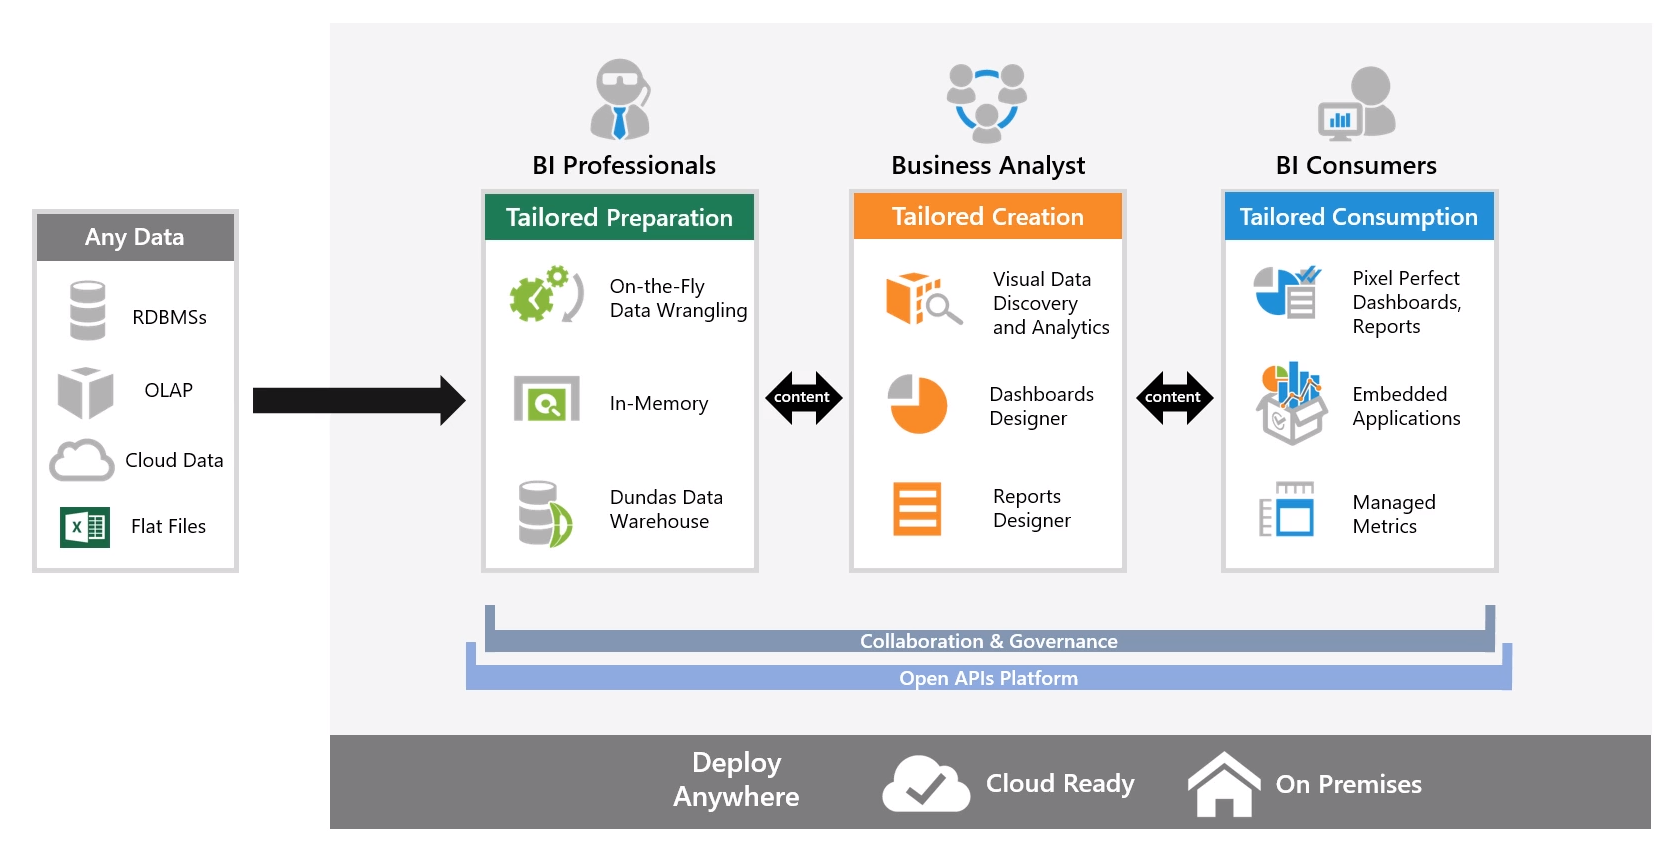
Key Benefits and Features
Self-Serve Business Intelligence
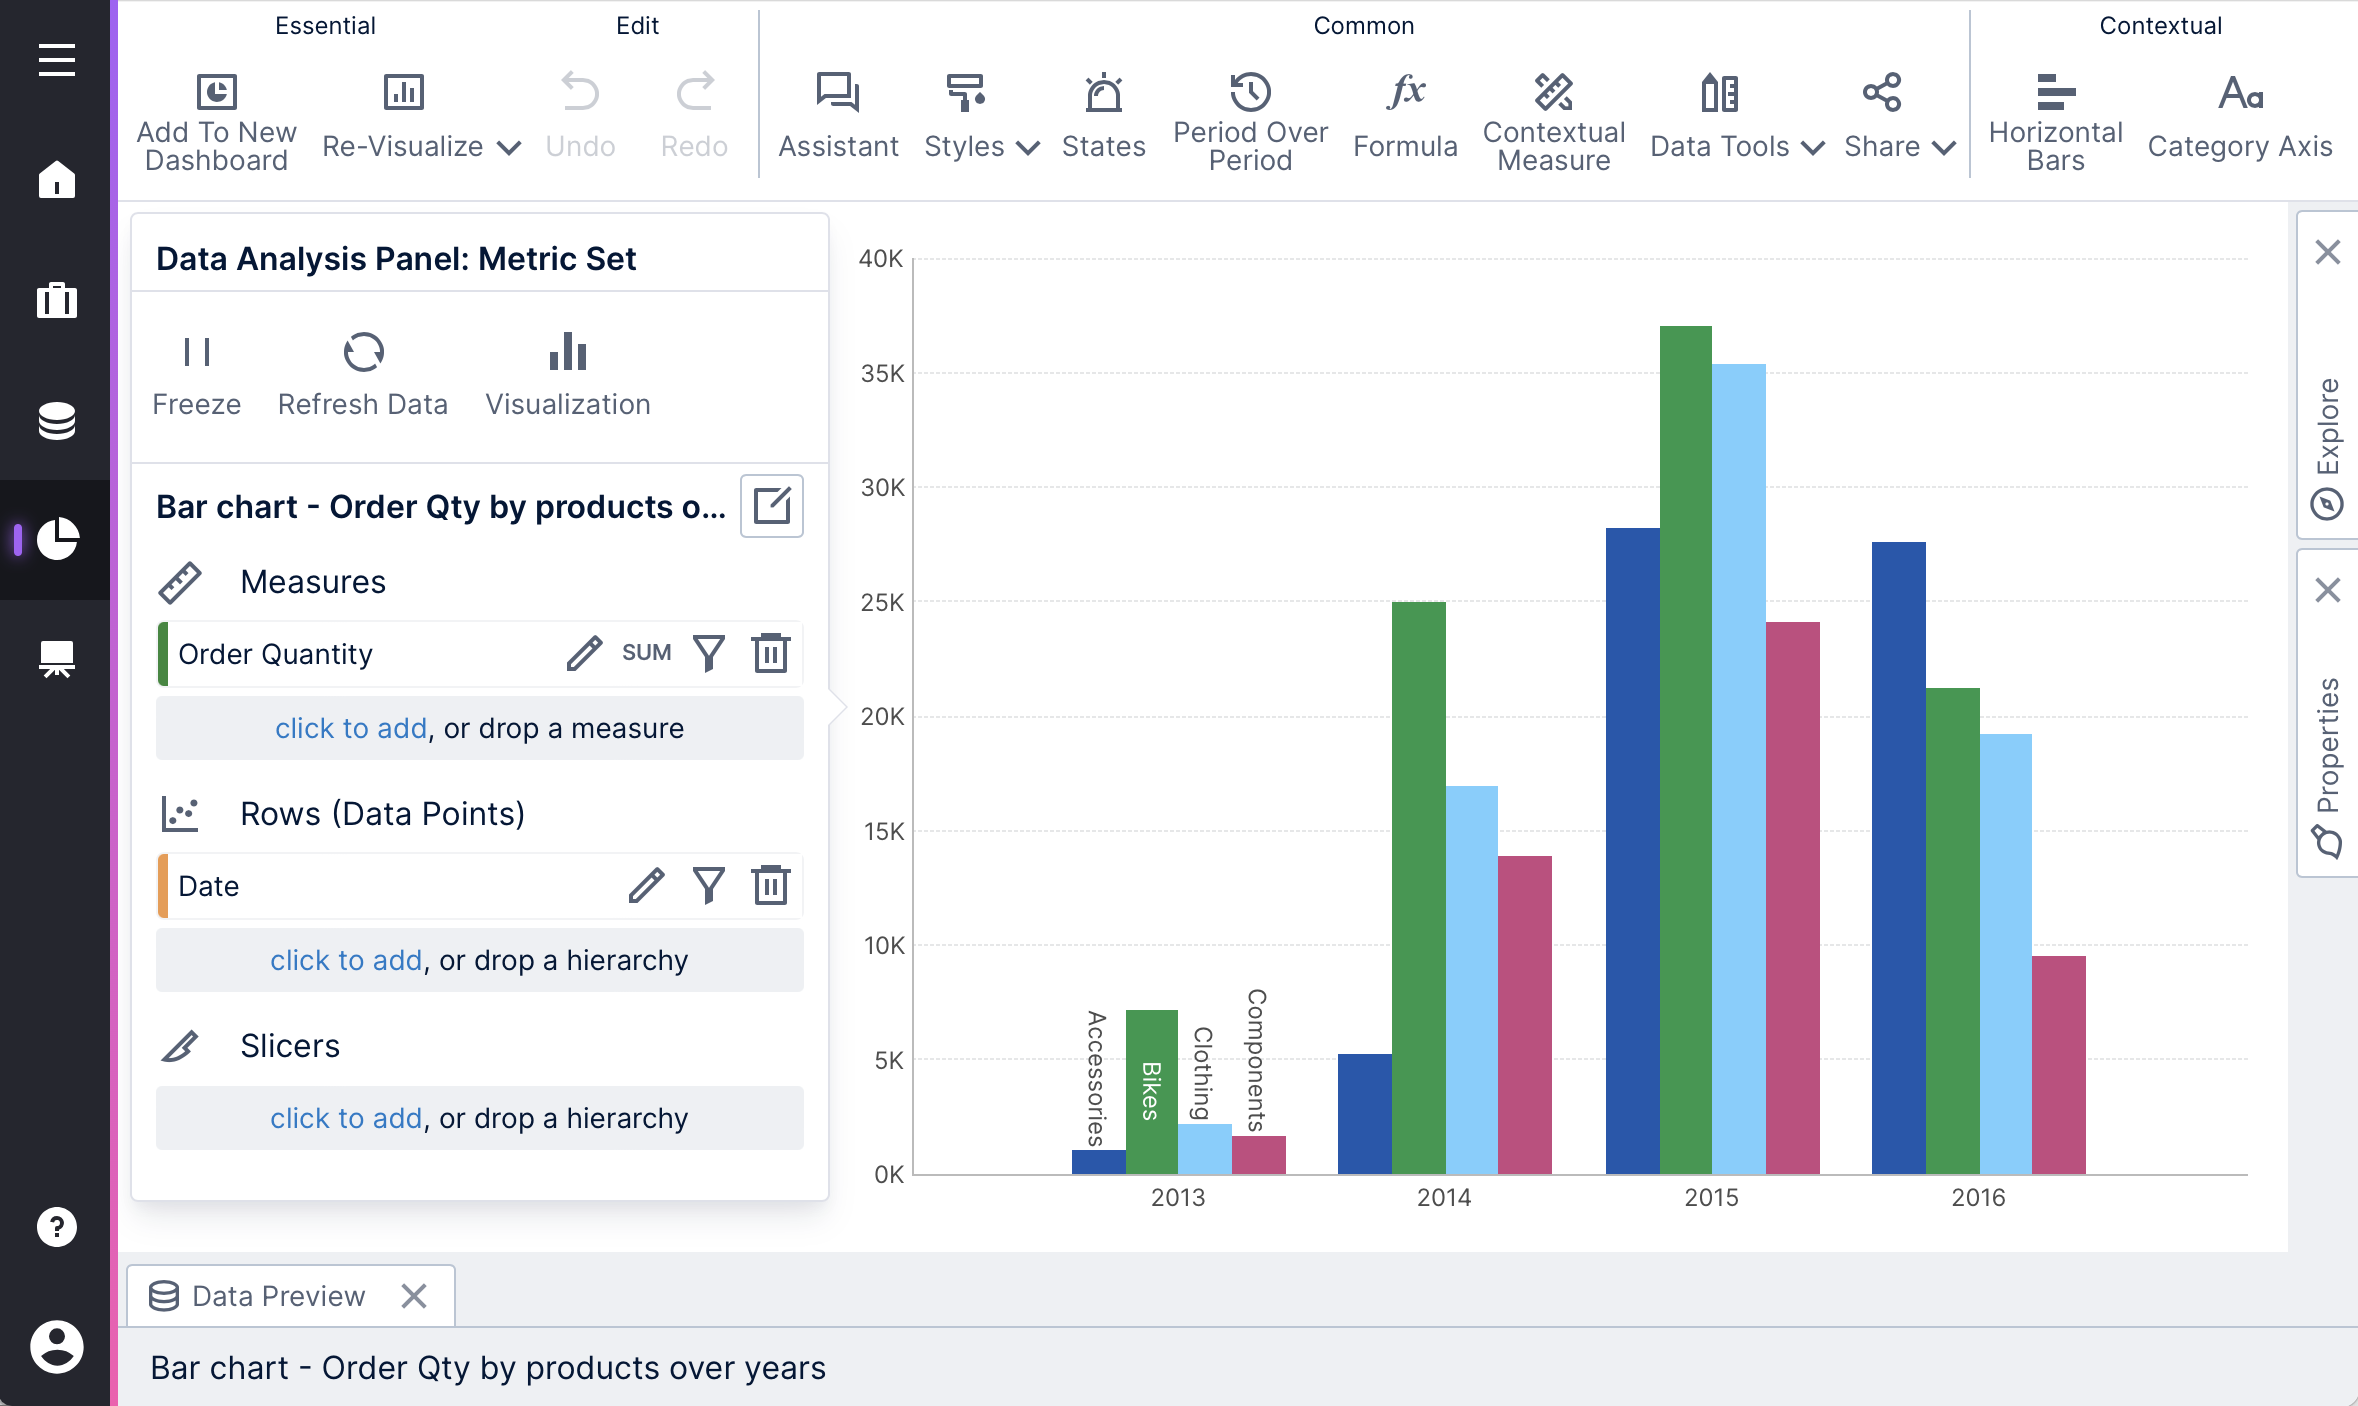
Perform data exploration and analysis, run ad hoc queries, and create your own dashboards and reports, all without having to involve your organization's technical or IT staff. Using interactive screens, you can easily explore available data sources, use intuitive operations to visualize your data, and arrange it in dashboard, multi-page report, scorecard, and small multiple views. Apply formulas using a familiar toolbar interface, access other analysis options with a single click, or ask the Assistant for help. Smart defaults and automatic data preparation are used throughout to provide a streamlined workflow, which means there are a lot fewer steps needed to progress from your data to desired visuals.
Fully Open APIs
The product itself was built on a completely open API platform designed for extensibility, integration, and embedding. Every capability you see in the user interface from administration through to analysis and views can be embedded, and is powered by public .NET, REST, and JavaScript APIs, which you have access to as well. You can insert your own custom extensions into virtually any part of the workflow using the same plug-in architecture used for built-in components, including data providers, transforms, formulas, visualizations, export providers, and much more. Tailor to your needs using custom CSS and JavaScript, the familiar syntax of DundasScript in calculations and advanced formulas, or the built-in JavaScript editor with pop-up help and suggestions.
HTML5, Mobile & Touch
The client-side is based entirely on the latest web standards including HTML5, JavaScript, and CSS. There is no requirement for browser plug-ins, or for users to install software. This means works and looks the same on a desktop as it does on a mobile device such as a tablet or smartphone. The user interface fully supports touch-based gestures so you can analyze data or design dashboards and reports directly on an iPad, or administer from your phone. All you need is a standards-compliant browser for your device.
Data Visualizations
A wide array of data visualization types are provided that you can use to analyze and view your data, including a complete chart library, maps, tables, gauges, relationship diagrams and more. Our visualizations are highly interactive and responsive, with intuitive animated transitions, and with performance and support for ad hoc analysis in mind. We've programmed our visualizations with styles and behavior that automatically conform to established best practices in data visualization, and smart visualizations can make choices and recommendations for you as you work with your data, including one-click advanced analytics. Each visualization is rich with features and customization options for optimal gaining and sharing of insights.
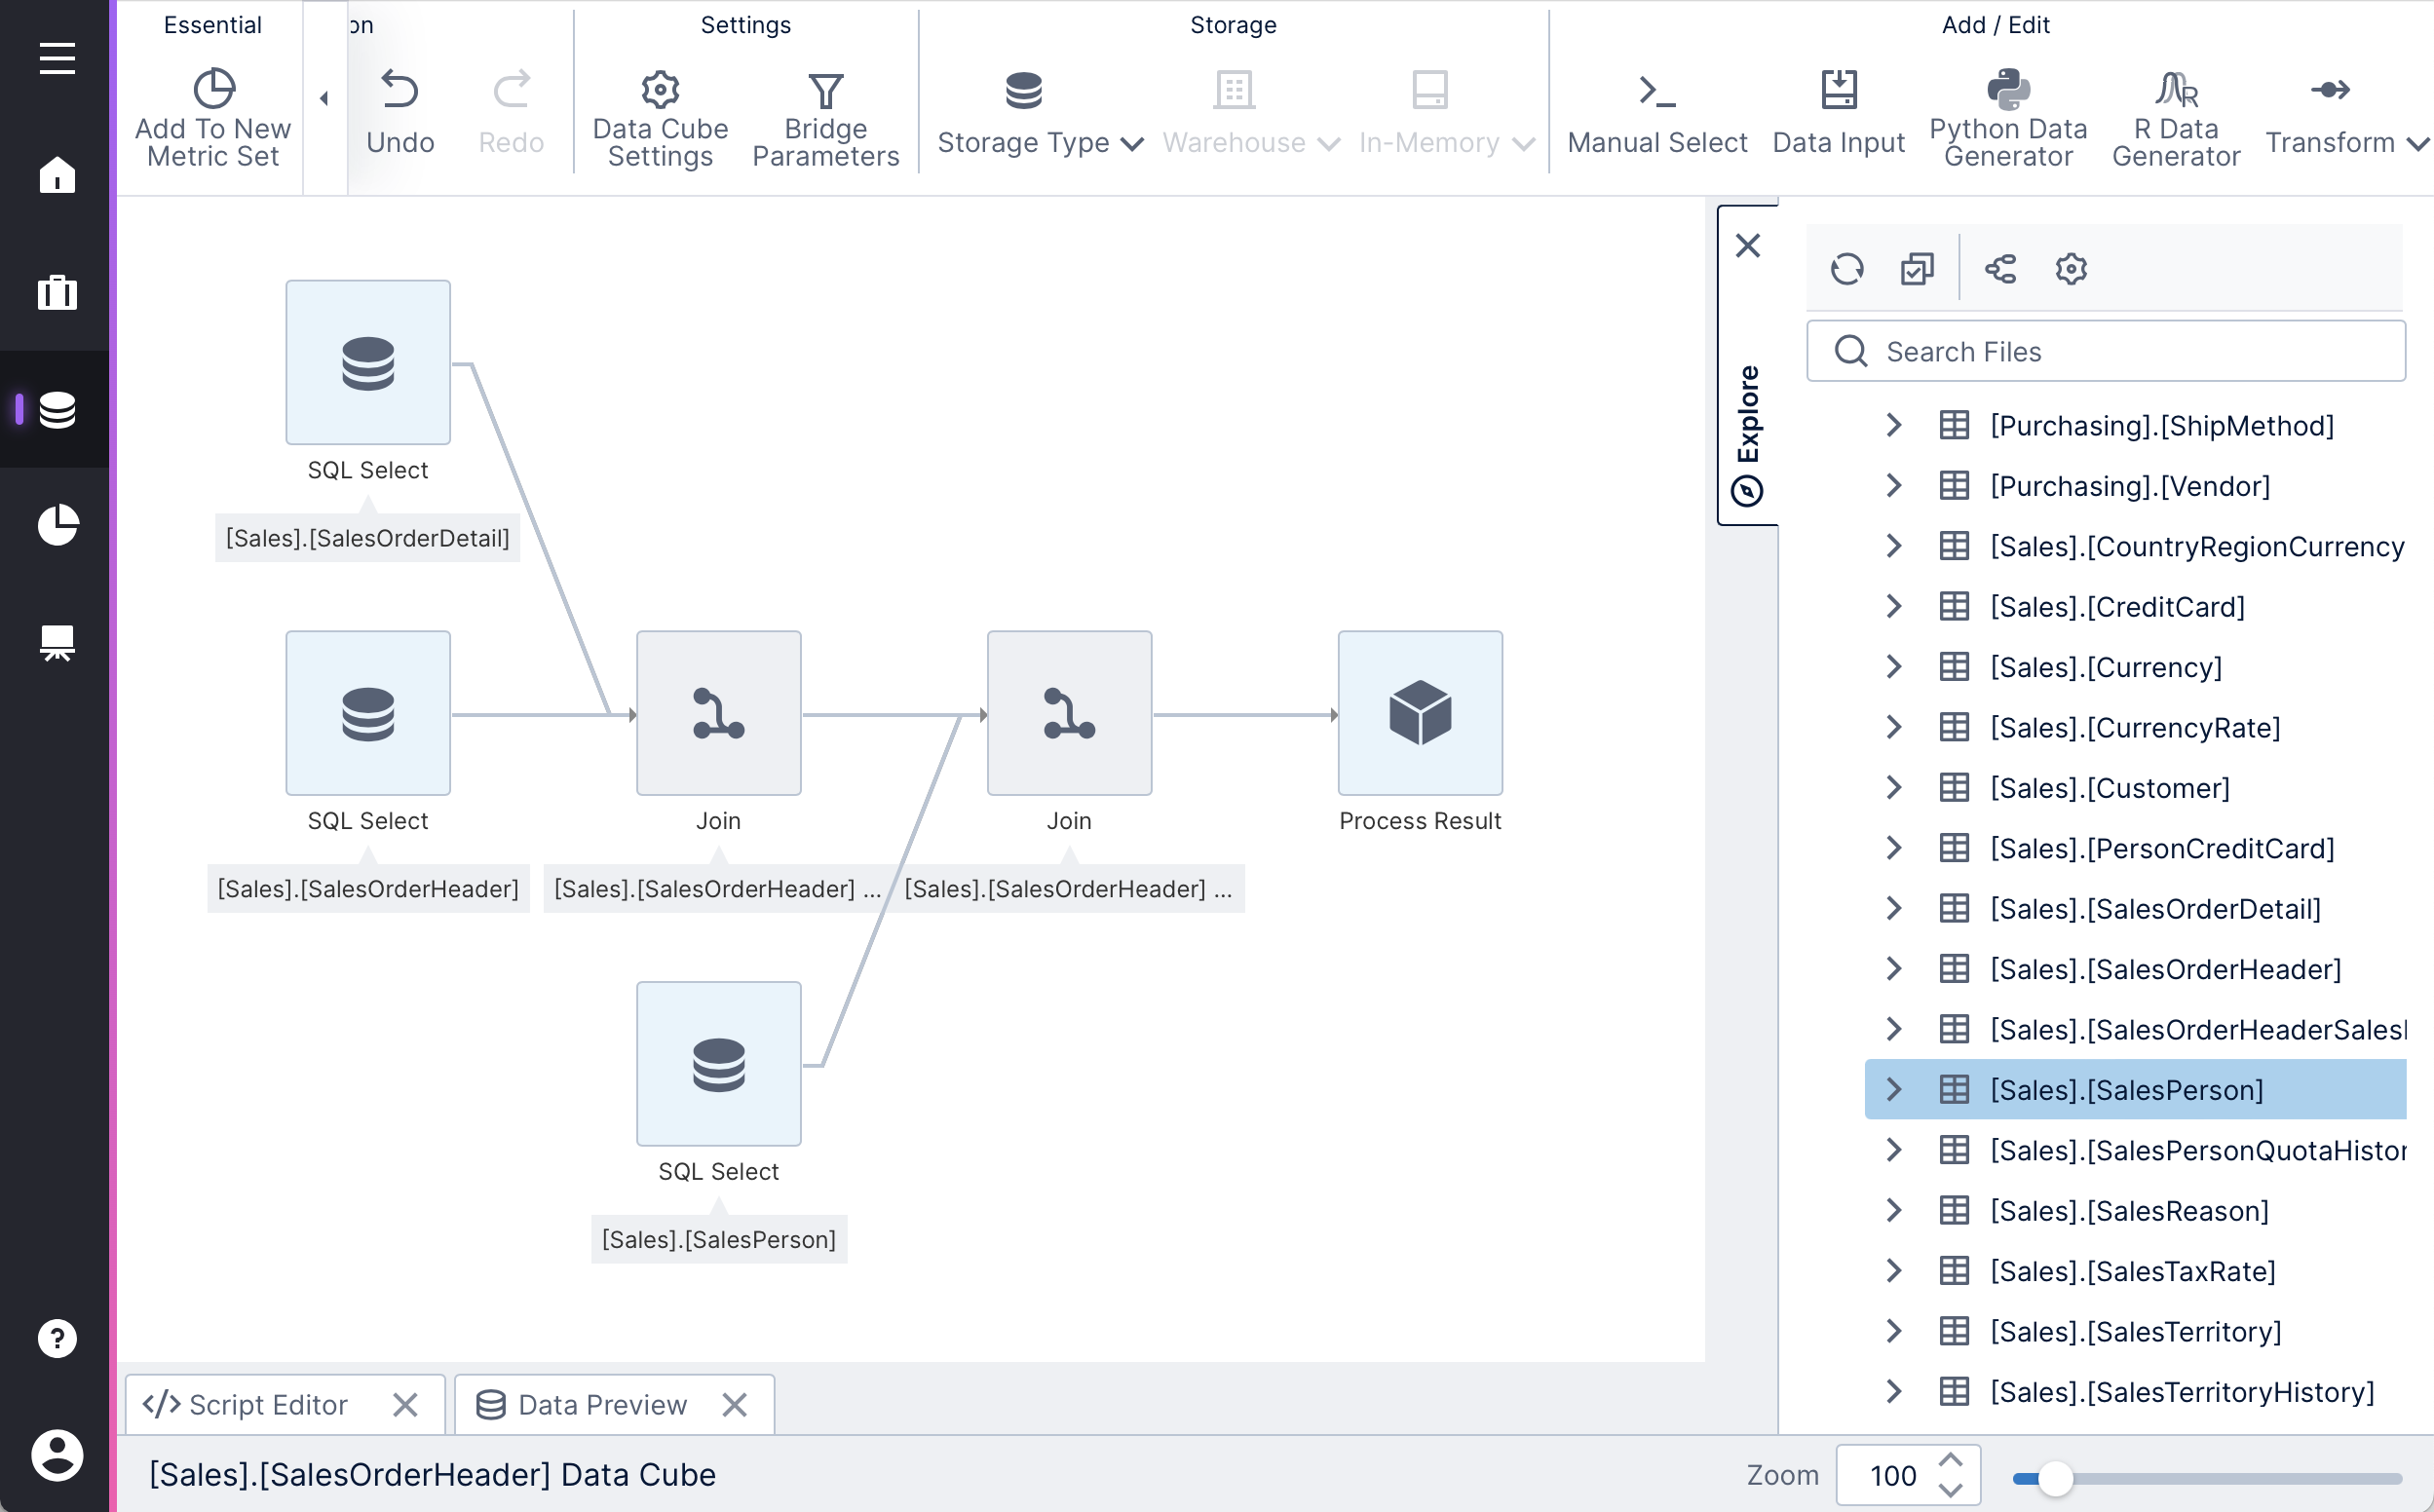
ETL Layer & In-Memory Analytics
Extract-Transform-Load (ETL) capability is built-in directly via our data cube layer. A wide variety of transforms are available for you to add and connect together to perform data cleansing, integrate data from different sources, access machine learning and other advanced analytics with R or Python, and any other data preparation you may need. Data cubes can also store data input through a spreadsheet-like interface or through custom forms on dashboards. The output of a data cube is a reusable data model you can prepare with predefined formatting and metadata and share with others. Connect to your data live, store it as needed in our internal data warehouse for improved performance, or build it as an in-memory model to enable even faster analytical query results.
Administration & Configuration
A flexible data security model is provided, including complete built-in support for optional multi-tenant / SaaS deployment. You can use whatever form of authentication you need for seamless integration with your own applications or systems, with a variety of standard protocols ready to use. For scalability, load balancing is supported through the use of application and data processing server groups, and containerization and Kubernetes support for scaling on cloud or server cluster deployments. Authorized users can access administrative tasks from the application's main menu, using intuitive interfaces to manage the complete set of configuration settings, logs, licensing, user account management, and other application functions, without additional tools.
See also
- Video: Dundas BI Overview
- Seat types
- Understanding the data model
- Metric set analysis tools
- Design overview
- Security overview
- Administration overview
- Developer resources