1. Overview
This article shows examples of filtering data using the Filter transform with tokens as filter values, which can include attributes or custom attributes describing the current user for user-dependent filtering.
2. Current Display Name token
This walkthrough shows you how to filter data per user by using the Filter transform and the Current Display Name attribute token.
2.1. Connect to data
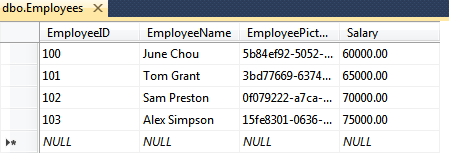
Create a new data connector to the following SQL Server database table which contains employee and salary information. The goal will be to create a dashboard that lets employees see their own salary only.
2.2. Set up user accounts
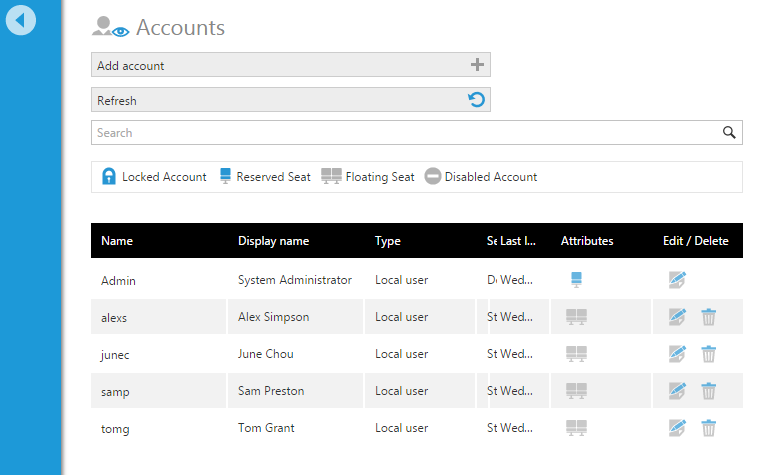
Set up user accounts in Dundas BI as shown in the figure below. Note that the account display names match the EmployeeName column from the SQL table.
2.3. Create a data cube
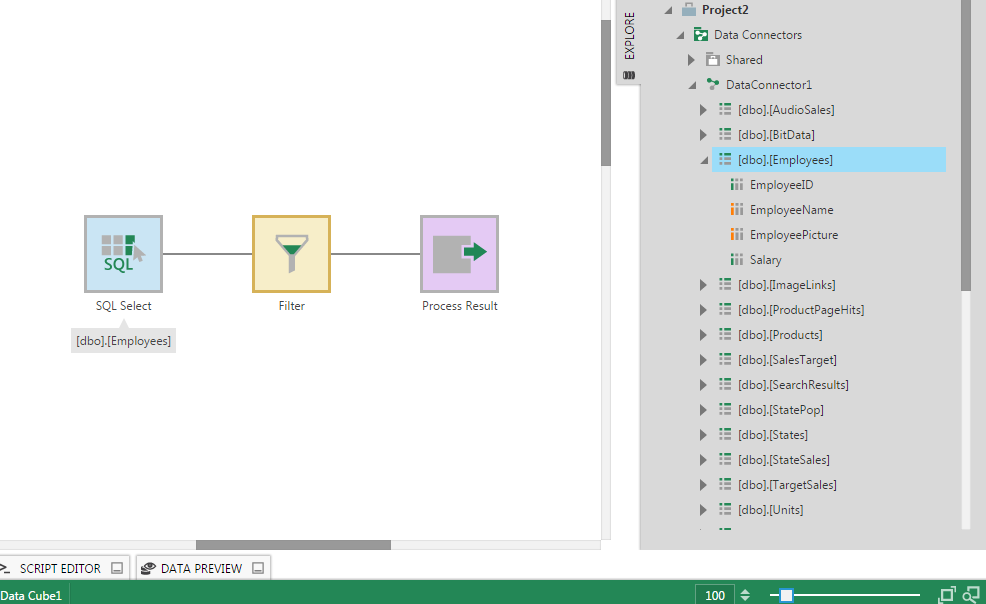
Go to the Explore window and expand the data connector. Locate the Employees table.
Create a new data cube and drag the Employees table to the canvas.
Select the connection link and insert a Filter transform.
Right-click on the filter transform and select Configure.
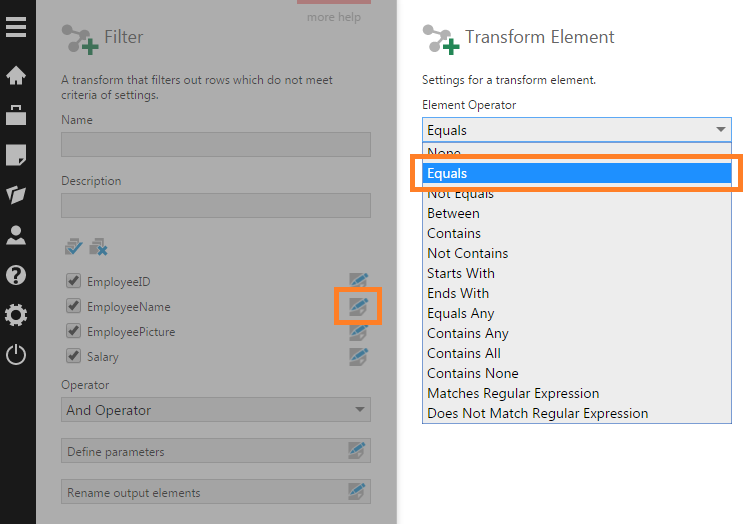
In the Filter dialog, click the Edit button beside the EmployeeName column.
In the Transform Element dialog, set the Element Operator to Equals.
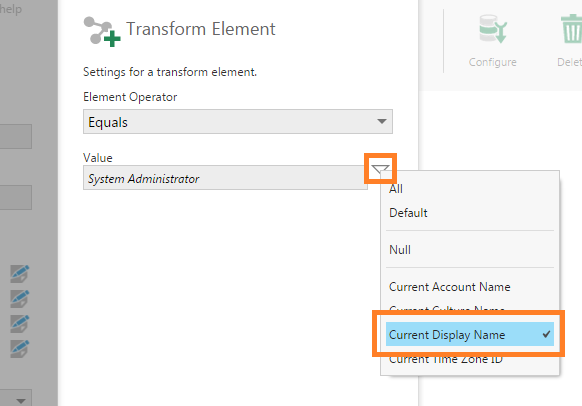
Instead of hardcoding a filter value, open the Value token menu and select Current Display Name. This token value resolves to the Display Name of the current Dundas BI user account.
The data cube is now complete and you can check it in.
2.4. Create a metric set
Next, create a new metric set by dragging the Salary measure and EmployeeName hierarchy from the data cube to the canvas. The resulting table visualization won't display any data though unless you happen to be one of the employee users.
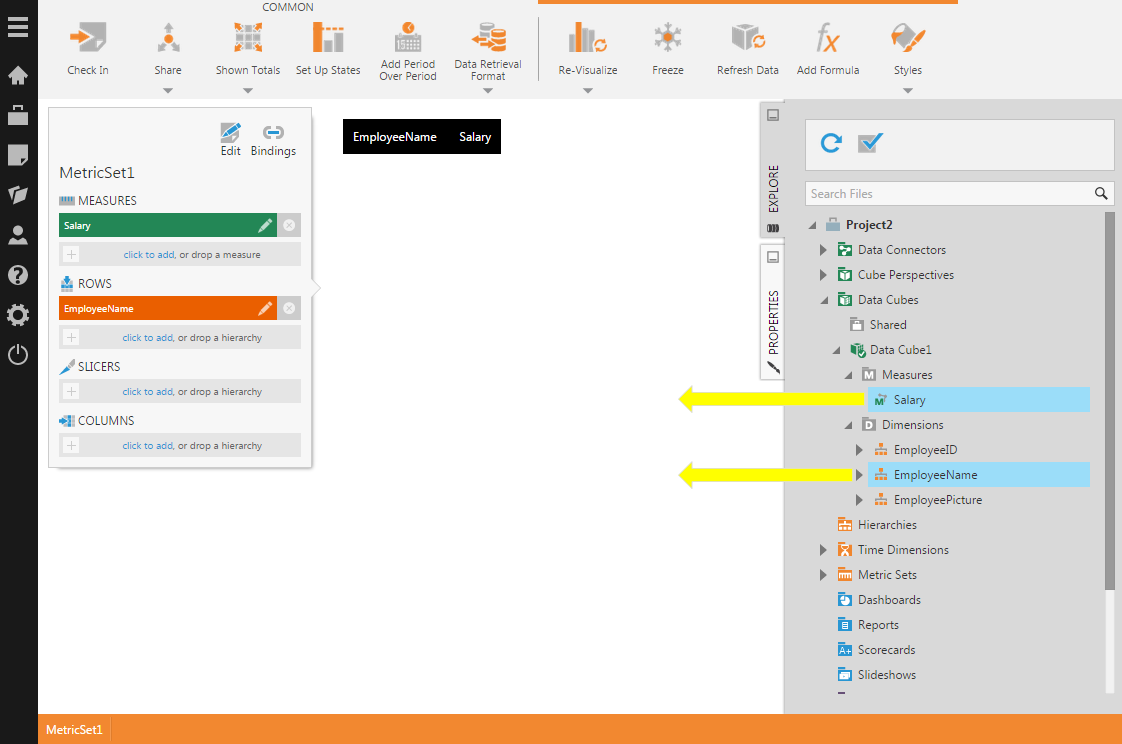
Check in the metric set.
2.5. Create a dashboard
Create a new dashboard by dragging the metric set to the canvas; it will appear as a table visualization without any rows.
Check in the dashboard.
2.6. View the dashboard
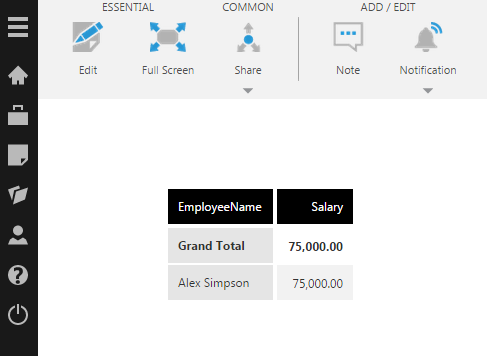
Log out of Dundas BI and log on as one of the employee users. Open the dashboard for viewing and verify the table visualization shows the salary for this user only.
3. Filtering out Null values
There are a couple of ways to filter out Null values from your data using the Filter transform and the Null token.
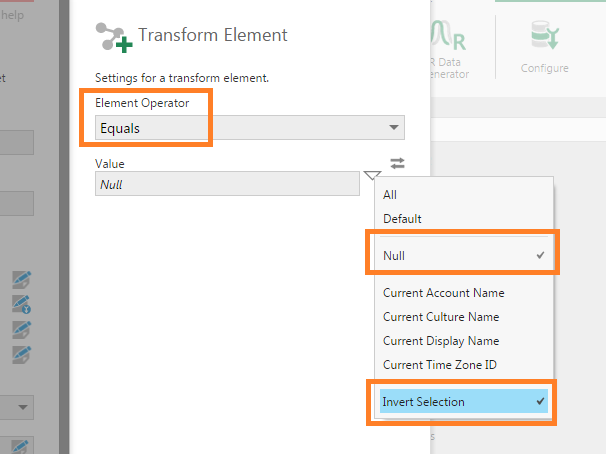
The first method is to open the Filter configuration dialog, and edit the column containing possible Null values. In the Transform Element dialog, set the Element Operator to Does Not Equal. Then open the Value token menu and set it to Null.
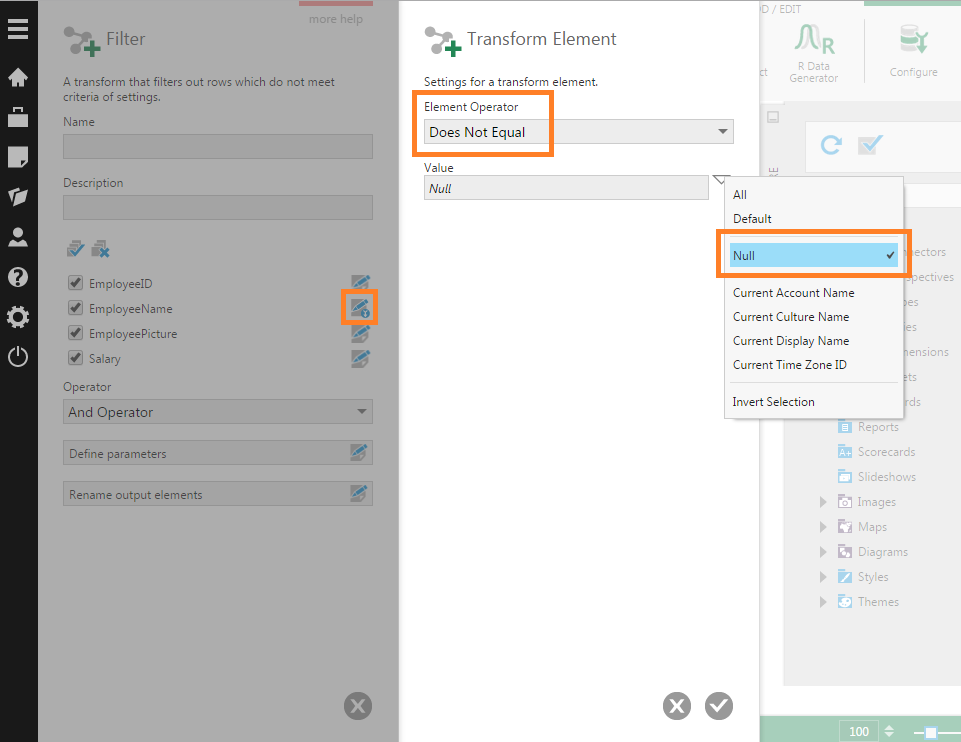
The second method is to set the Element Operator to Equals. Then open the Value token menu and set it to Null and also select the Invert Selection option.