1. Overview
By default, copies of a chart that are generated in a report, scorecard, or small multiple share the same numeric and date/time axis scales. However, there may be cases where you want to change this behavior. For example, if you have a line chart where it is more important to see the shape of the curve than to compare Y-values. You can also share scales between copies of bullet graphs and other gauges.
If you want to share axis scales between two different charts in edit mode, use the Share the scale with another chart or axis option described in the article on Using chart properties. Gauges have a similar option for sharing their scales.
2. Stop sharing scales with copies
The left (Y) axes in each chart normally all share the same range by default when repeated in a report, scorecard, or small multiple, as in the following report example:
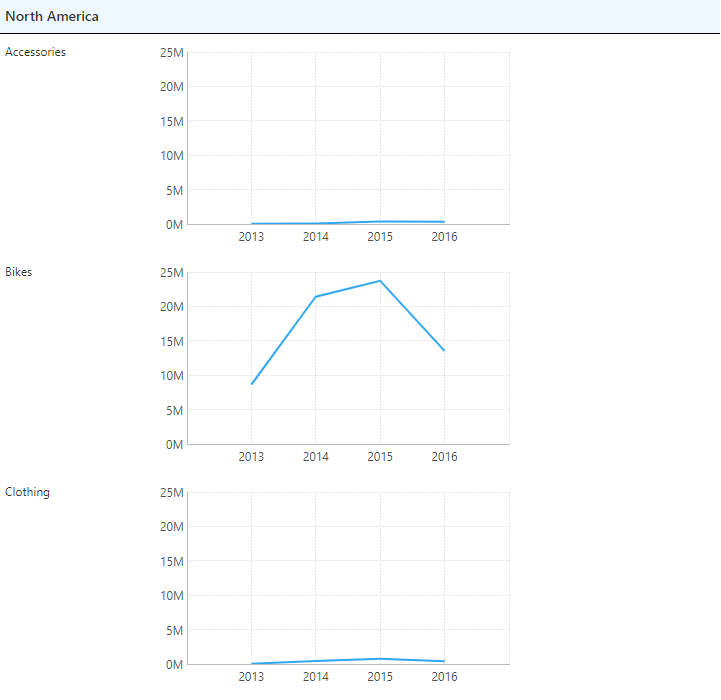
In this example, the values vary significantly between each chart, leading to more unused space and possible difficulties interpreting the trends of each line.
To prioritize viewing the data in each chart over comparing the magnitudes between them, you can choose not to share the same range of values in each axis.
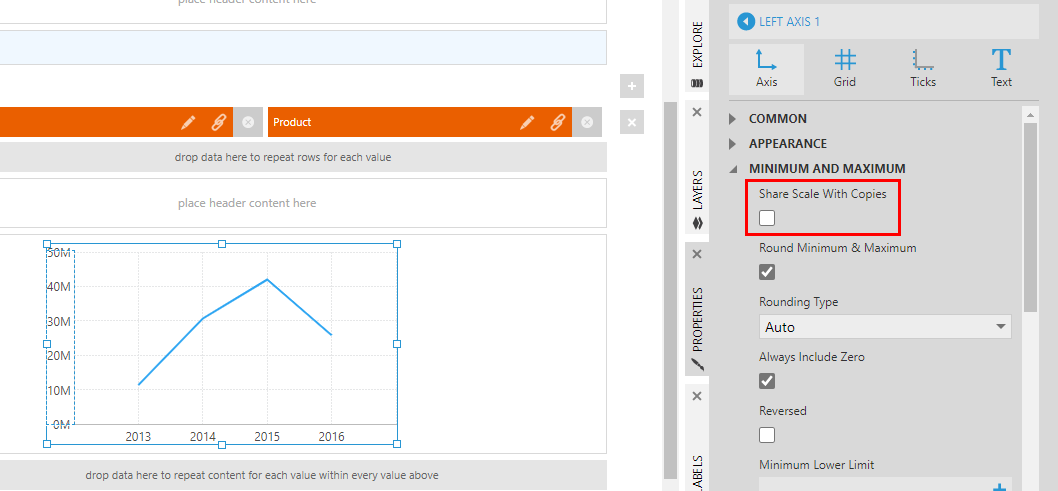
When editing, select the chart and click its left axis to select it, and open the Properties window (or right-click the left axis and choose Axis Properties). Uncheck the Share Scale With Copies property.
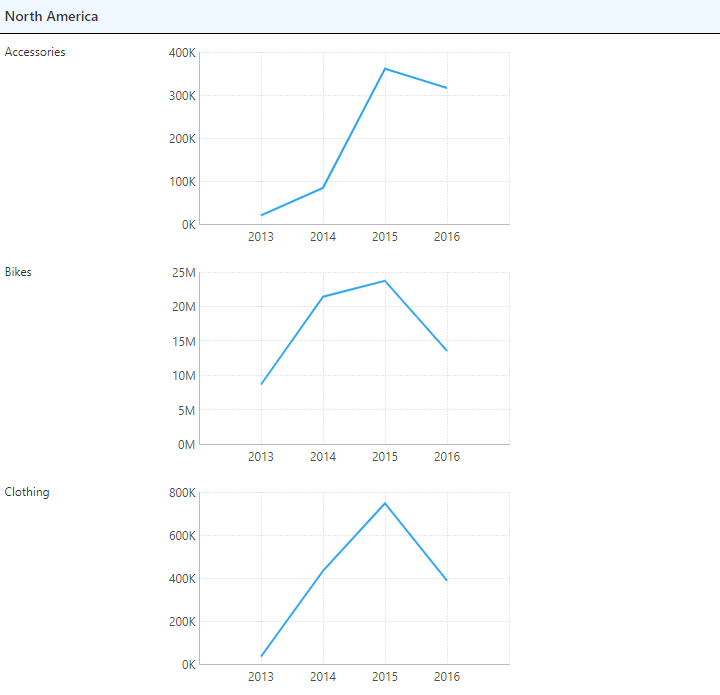
When viewing our example with this property unchecked, each chart can now have a separate range of values along its left axis.
This property works the same way for date/time scales. For category scales, this option is normally disabled by default but you can enable it if the same categorical data (such as text) should be in the same place along the axis in each chart to make them comparable.
Gauges have a similar option in their scale properties that you can enable.
3. Only share scales in the same grouping
Rather than giving every chart or gauge its own range of values along the axis, you can enable the Share Scale With Copies property but share scales only within each grouping.
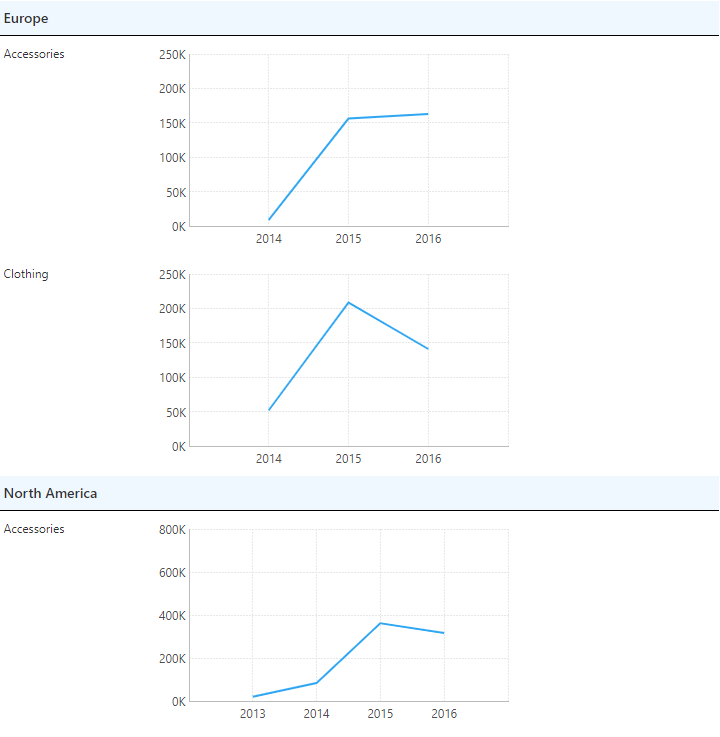
In this report example, there is a parent or outer grouping for each continent, and a child or inner grouping displaying a chart for each product category within each continent.
Selecting the chart or gauge, open the Properties window and select the Only Share Scales In Same Grouping property option.
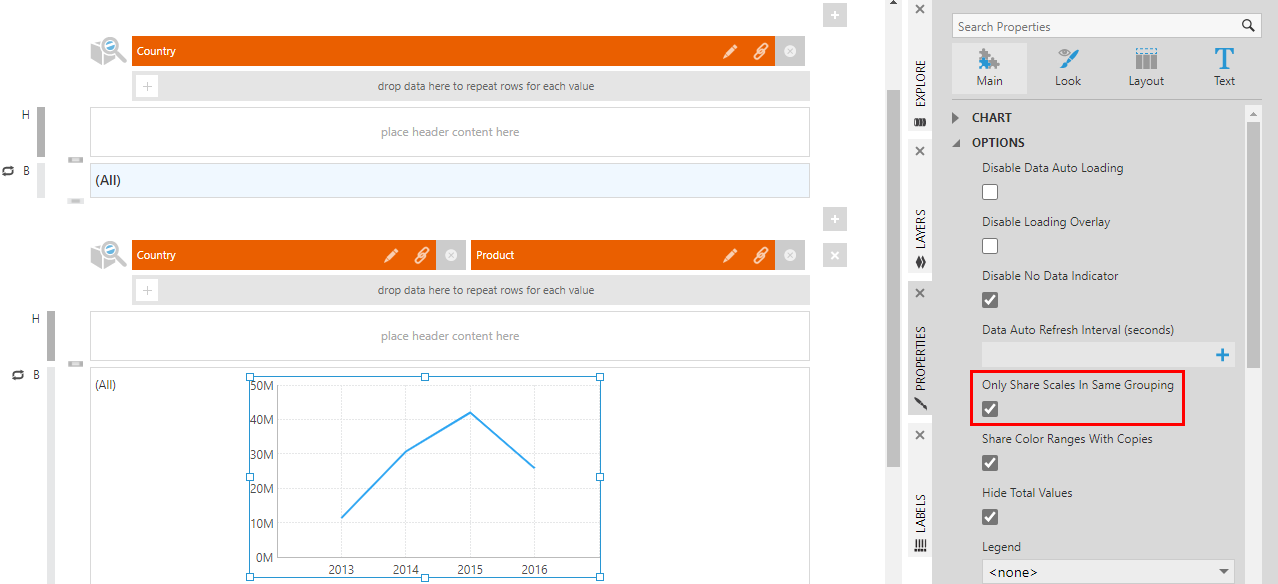
When viewing this example, the charts share the same range of values in their left axes but only within each continent's values.
4. Connecting a separate axis
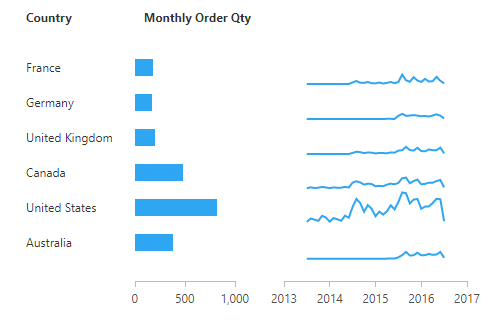
Another way for charts, bullet graphs, and linear gauges to share an axis scale is to display the axis separately in a header or footer and connect it to the chart or gauge.
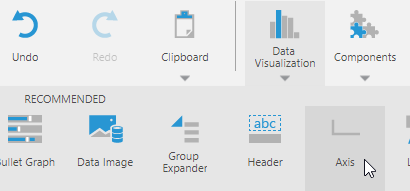
When editing a report, scorecard, or small multiple, click Data Visualization in the toolbar and you can find Axis located under Recommended.
Position it in a header or footer and ensure its outer boundaries are positioned to line up with the chart or gauge, as in the following scorecard example:
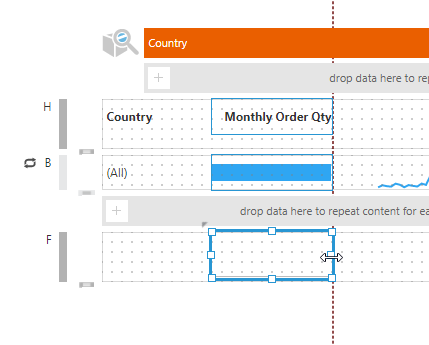
In the toolbar, click Connect Axis. In the Properties window, select the chart or gauge in the dropdown.
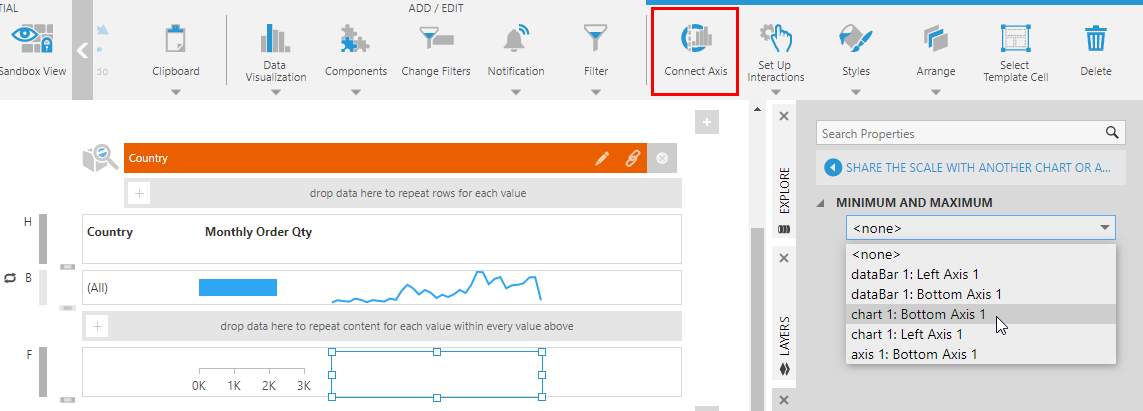
When viewing, the data points in the charts and the gauge pointers will line themselves up accurately against the axis scale in the header or footer, which also means they are sharing the same axis range.