Humanity is addicted to circles. Understandably so, circles are everywhere; our vehicles, our food, even our faces. It’s no wonder we try to include them in our data visualizations, but should we?
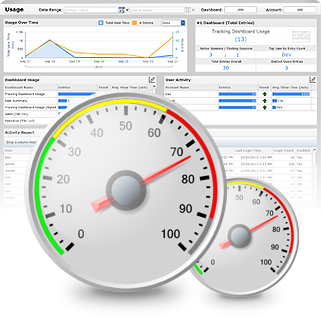
What if you want some feedback about your dashboards, to know who is using them, how often they are being viewed, or what time of the day generates the most interest. Dundas Dashboard V5 can help.
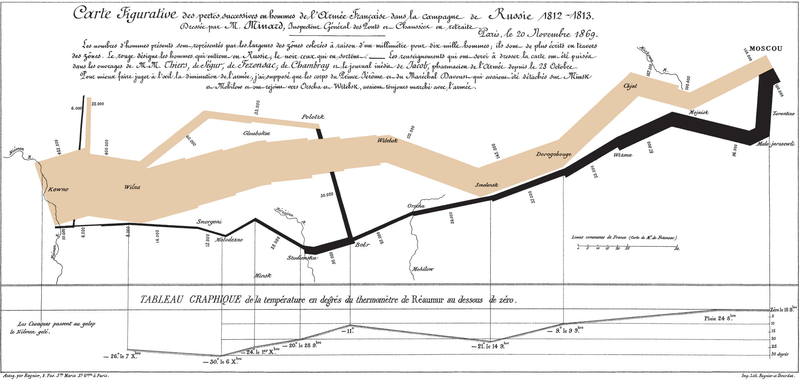
Data visualization has come a long way. From simple cave drawings depicting the success of a hunt to the intricate dashboards we have today connecting to millions of rows of data.
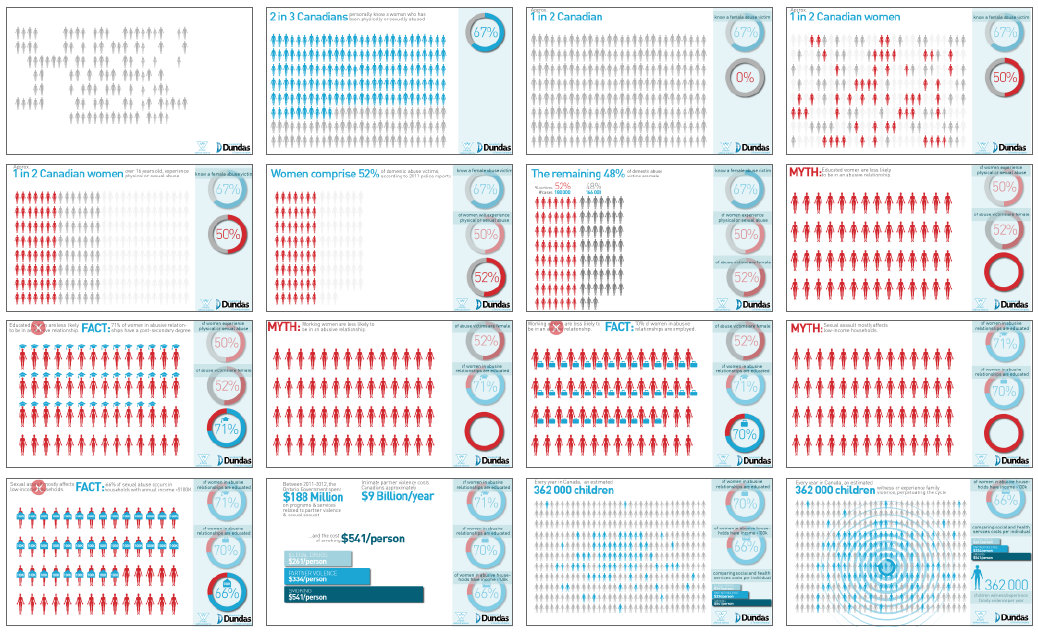
On September 26th the Walk A Mile In Her Shoes event in Toronto featured an animated infographic at Yonge & Dundas square in the heart of the city that we, Dundas Data Visualization, created for them. Adie Margineau, the designer responsible for this project, discusses her process in putting this great piece together.

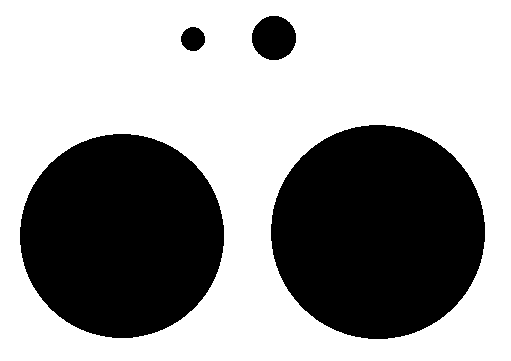 Humanity is addicted to circles. Understandably so, circles are everywhere; our vehicles, our food, even our faces. It’s no wonder we try to include them in our data visualizations, but should we?