If you’re new to dashboards there may be a lot of jargon and acronyms that you’re not overly familiar with. This post will cover some of the most commonly used phrases, terms, and acronyms when it comes to dealing with dashboards.
I'm convinced that if you want to bend or break the rules — and there are some rules in information design, and they are not the product of white old men's aesthetic choices, but of how the visual brain works — first of all you need to know them well: Study them, understand them, and apply them until they become second nature.
Check out the interesting information we weren't able to include in our infographic and let us know what you would have enjoyed seeing on it using interactive elements.
Some insight into the process of creating our holiday infographic, some interesting facts that we weren’t able to include, and some of favorites that didn’t make the cut.
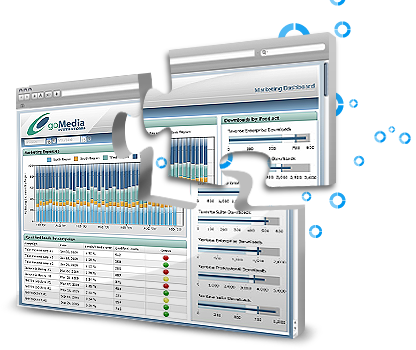
Dashboard solutions allow an organization to visualize and monitor their data in a meaningful manner, while enabling them to make better operational and strategic decisions. But what questions should we be asking ourselves before undertaking a dashboard project?
 If you’re new to dashboards there may be a lot of jargon and acronyms that you’re not overly familiar with. This post will cover some of the most commonly used phrases, terms, and acronyms when it comes to dealing with dashboards.